March 2007
Monthly Archive
Fri 23 Mar 2007
Posted by Jason G. under
CommentaryNo Comments
I find myself reading a few good blogs consistently, one of which is The Big Picture. Here are two of the recent highlights:
Small Cap vs. Large Cap
Today, the market cap weighting is once again hiding something significant from investors: This time, its the fact that the stock market isn’t particularly cheap. The relative cheap prices of the OEX100 (S&P100) is hiding the relative prices of the rest of the index…
How different? “According to Ford Equity Research, the average P/E ratio among the 50 largest-cap companies is now 19” — thats about 30% of what it was for the grouo in March 2000. On the other hand, the 50 smallest companies P/E ratio is now 30.7 — 50% higher than it was in 2000.
The Market as a Forecasting Tool
Mr. Market is at times a Rorschach test, a blank slate upon which participants project their hopes and fears. He reveals the personality characteristics and emotional functioning of investors by their interpretations of the noise he generates. Remember this the next time you are tempted to create a grand theory of what happens next based only upon a few of his recent squiggles…
Thu 22 Mar 2007
Posted by Jason G. under
CommentaryNo Comments
Just found this annecdotal quote from Mish’s blog (not sure if it is true, but it could be):
Earlier this year I received a note saying the Core Bond Fund in my 401k was changing to a new bond fund this year. They nicely transferred the old holdings to the new fund without any cause for action on my part.
…The new fund is almost 37% invested in mortgage securities. The old was only a tad over 1%.
Imagine my surprise when the value of the [new] fund had dropped almost 13% from Friday to today! [3/2/2007 -3/5/2007]
(more…)
Wed 21 Mar 2007
Posted by Jason G. under
Commentary1 Comment
I find it amusing when the USPS announces their “forever stamp” and the implicit statement that makes regarding inflation…
The post office is basically admitting that their services and their costs will always continue to rise, a sign of perpetual inflation.? While the forever stamp makes sense as a business case (it can’t be cheap to make those 1c and 2c stamps all the time), it is another example of the increasing costs of government service, and the pricing distortions caused by monetary inflation.
Tue 20 Mar 2007
Posted by Jason G. under
CommentaryNo Comments
Here’s a rather peering look into the mechanics in ARM and Option Arm loans that is an interesting read…? There are many different possible reasons for rates (and payments) to reset or recast…
The short version — it’s so complicated that it takes around 10 paragraphs just to cover a hypothetical loan.
Any wonder why the average homebuyer might not understand what they’ve gotten themselves into?? Especially when some smooth talking salesman tells them that their payments won’t go above $X per month for the first year… and after that you can simply refinance if the payments adjust too high?
Sun 18 Mar 2007
Posted by Jason G. under
Commentary[3] Comments
I’m amused sometimes when I stumble on things like this…
Bill Cara pointed to an interview that Jim Cramer recently did on “professional juicing”, or basically manipulating markets to help your positions… Here it is from You Tube: (more…)
Wed 7 Mar 2007
Posted by Jason G. under
CommentaryNo Comments
I’m always annoyed when I see something like this (from yesterday’s Yahoo Market Overview):
9:40 am …a sense that a bottom has finally formed following a week of aggressive selling pressure gives stocks a sizable boost right out of the gate.
The big lie is that after only 10 minutes of trading the author of this tidbit claims to see market behavior that is significant enough to cancel out the entire last week‘s worth of selling.? (Technically two weeks of selling, but the largest down moves were last week.)
What is happening? The author is mixing multiple time frames to try and draw comparable conclusions. Anyone can do it by accident, including me, but those tasked with commenting on the markets for the financial press seem to do it with alarming frequency.
Remember that we can observe the same phenomenon on many different time frames… We can see a bounce from a low on a daily time frame, monthly, yearly, etc. When trying to understand if a week long selling spree is over, we really need to see several days, if not a week, of strength.
One of the many important concepts of trading is to be aware of your time frame. It’s easy to be distracted by the action of the last 5 minutes (the prices keep changing after all!), but if you invest over longer time frames (months and years) then a one day bounce (or dip) is not usually significant.
What would be significant?
- Bullish Significance – Several days of buying on good volume, with a general upward trend. A series of higher lows when the market does have a down day or series of down days.
- Bearish Significance – Failure of the NDX‘s ability to climb above 1750 (a very short term target) and lower volume on up days like today.? A series of lower lows and lower highs…
Tue 6 Mar 2007
Posted by Jason G. under
Research[2] Comments
I found a good little blurb (and a good chart) on Ticker Sense regarding the S&P 500’s 5% decline and previous such declines…
With today’s near 1% decline, the S&P 500 is now down 5.86% form its peak on 2/20. This is the seventh time during this bull market that the S&P 500 has declined by 5% or more from a peak. In [the chart], we plot the S&P 500 highlighting each correction in red. The lower chart shows the percentage decline in each correction on a cumulative basis (from peak to trough).
On average, declines have lasted an average of 74 calendar days. Once the market does reach its low point, it has taken an average of 64 calendar days to recoup the losses.
While looking at historical patterns can mislead as easily as it can enlighten, it is worth noting that we’re not talking about a short-term one-week dip and one week recovery here.? With an average decline timeframe of 74 calendar days, we aren’t going to see the markets make new highs tomorrow if/when a recovery starts. (more…)
Mon 5 Mar 2007
Posted by Jason G. under Uncategorized
No Comments
You may remember that I wrote about P/E compression a while back. Here’s a quick, updated view of the long-term P/E compression effect in the S&P 500 (brought to you by TickerSense):
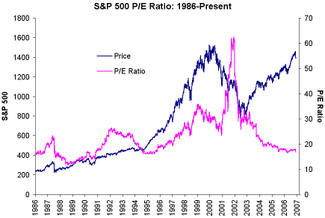
While earnings have indeed been impressive, P/E ratios continue to grind lower. Even with earnings rising and prices going up, earnings have been rising faster than prices causing the ratio to fall. (more…)
Sun 4 Mar 2007
Posted by Jason G. under
Trading[3] Comments
Join me for a bit of silly fun in the CNBC “Million Dollar” trading contest, which starts on Monday. The prize is a “million dollars” paid in an annuity, but heck, I’ll still take it if I win.
The basic rules:
- You can only buy and sell stocks at the closing price of the day (market orders only)
- No short selling, no options, no leverage
- Mergers and share splits apply, but dividends don’t
- Stocks must have a $500 million market cap as of their closing price on Friday March 2nd (you can use the Yahoo Stock Screener to find all 2,723 tickers that should be elligible for the contest)
One of those crafty folks over at Fool.com has discussed the way to win the contest… He basically points out how to win any trading contest — take the biggest risks that you can and hope that you’re one of the lucky winners. A sound, safe, low risk strategy does not win contests.
It should be very interesting to see how the first week of the contest fares if the market continues to behave like it did last week…