Thu 26 Apr 2007
It’s amazing to see the Dow above 13,000… an all-time high. But it’s interesting to realize what that means… what is really at an all-time high? The Dow is a price weighted index (read how splits and dividends are included if you really want to know), which means that not every component contributes the same amount to its ups and downs…
Different weighting is actually normal, but the Dow has an unusual weighting — it’s components are weighted based on price. That means that stocks with higher prices have a higher impact on the index (with some caveats — nothing is simple). In contrast, the S&P 500 is market-cap weighted, which can cause it’s own caveats and unusual behaviors…
A side effect of the price weighting is that (relatively) smaller companies like Boeing, 3M, and Caterpillar have a larger impact than larger companies like GE, Microsoft, and Pfizer.
You can find the components on many places, including the official website, and updated intra-day prices/changes per component at Yahoo Finance.
Here is a chart of the component’s market caps, ordered by weighting (click to zoom, components on left have highest weighting, and the most impact on the index’s value):
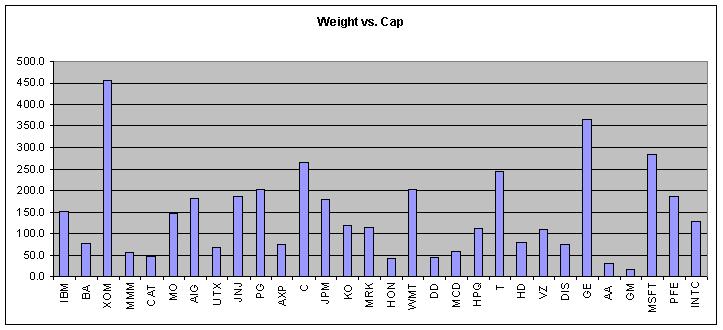
If the Dow is up big on a given day, it is worth looking to see how the individual components are doing… for example IBM has the highest weighting at almost 6% of the index, and it has had a stellar two day run (95 to 102, or 6%, which is $10b increase in market cap). That 6% jump is a significant contributor to the index, and a good reason why we’ve seen such strength in the Dow.
Here is a chart of the performance (% price change) of the Dow components over the last two days… Same order as above, left to right in order of weighting in the index.
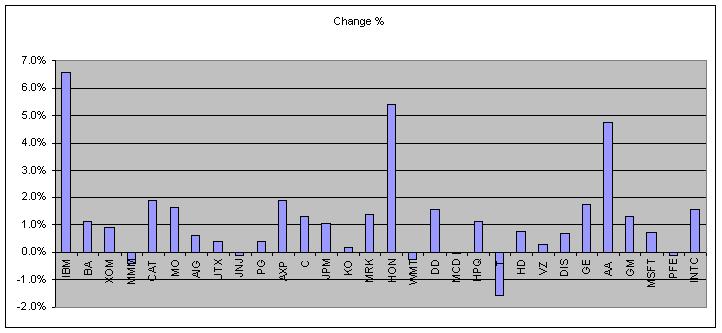
You may notice that only three components are up big in the last two days — IBM, HON, and AA. The rest of the components are much less mobile. I don’t mean to belittle the fact that 27 of the components are up for the two days, but unless you are holding IBM, HON, and AA (or really, just IBM due to its heavy weighting), you missed out on a lot of the strength.
On the flip side, if IBM, BA, XOM, or MMM start faltering, they will have a larger influence on the health of the Dow Index than some of the companies with lower weightings.
Here is the weighting for the Dow Jones Industrial Average (click on the headers to sort):
| Ticker | Price | Weight | Cap (b) |
|---|---|---|---|
| IBM | 101.46 | 5.9% | 152.8 |
| BA | 94.69 | 5.8% | 74.7 |
| XOM | 79.92 | 5.0% | 455.0 |
| MMM | 76.97 | 4.9% | 56.5 |
| CAT | 73.23 | 4.5% | 47.3 |
| MO | 70.47 | 4.4% | 147.9 |
| AIG | 69.98 | 4.4% | 182.1 |
| UTX | 68.04 | 4.2% | 67.7 |
| JNJ | 64.68 | 4.1% | 187.2 |
| PG | 63.53 | 4.0% | 200.5 |
| AXP | 62.32 | 3.8% | 74.0 |
| C | 53.8 | 3.3% | 266.1 |
| JPM | 52.82 | 3.3% | 180.4 |
| KO | 51.74 | 3.3% | 119.3 |
| MRK | 52.39 | 3.2% | 113.5 |
| HON | 53.99 | 3.2% | 42.1 |
| WMT | 48.81 | 3.1% | 201.3 |
| DD | 49.97 | 3.1% | 46.2 |
| MCD | 48.63 | 3.0% | 58.5 |
| HPQ | 41.87 | 2.6% | 112.1 |
| T | 39.14 | 2.5% | 244.4 |
| HD | 39.5 | 2.5% | 77.8 |
| VZ | 37.65 | 2.4% | 109.6 |
| DIS | 35.32 | 2.2% | 72.4 |
| GE | 35.41 | 2.2% | 364.1 |
| AA | 35.76 | 2.2% | 31.1 |
| GM | 31.07 | 2.0% | 17.6 |
| MSFT | 28.99 | 1.8% | 283.9 |
| PFE | 26.32 | 1.7% | 186.5 |
| INTC | 22.258 | 1.4% | 128.4 |
April 28th, 2007 at 9:00 pm
There’s a good breakdown at The Big Picture of how the Dow would have performed if it were a cap-weighted index…
http://bigpicture.typepad.com/comments/2007/04/which_is_perfor.html
May 4th, 2007 at 6:18 pm
Interesting that many are touting that today (May 4) marks the longest bull market in decades. Of course, they are using these weighted indexes (which change in composition on a fairly regular basis) as their measuring tool.
July 2nd, 2007 at 2:49 pm
There’s similar analysis for the Nasdaq 100 over at the big picture. 13 of the 100 stocks are responsible for 2/3 of the recent 12% rally…