Today’s Dilbert comic is a bit too realistic…

Sat 30 Jan 2010
Thu 28 Jan 2010
Well, we didn’t get much of a bounce on Monday… that doesn’t bode well for the overall direction of the markets.
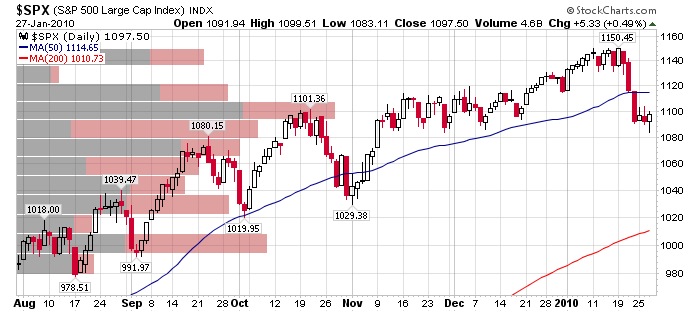
I ran some quick vol-by-price charts, and thought I would share. We’ve dropped 5% back into a pretty good congestion zone. A lot of shares have traded near current prices… We could very well wobble around in this range for a while yet. (chart source)
And here’s the longer term (3 year) chart:
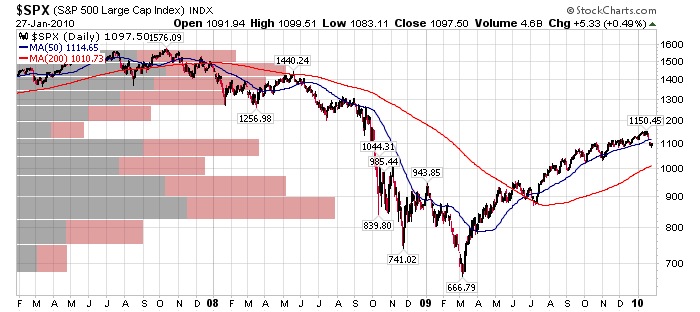
Looks like there is some bigger price gravity between 800-900 and back up around 1450. There are compelling arguments for going in either direction, so be careful with your commitments in one direction or the other.
Mon 25 Jan 2010
Here’s the “real” reason the market swooned at the end of last week… Goldman’s date for pricing their stock bonuses…
A humorous interlude demonstrates how the Administration’s quick-fire plans to punish Wall Street have in fact benefited firms such as Goldman which are increasingly paying bonuses in stock. As Bloomberg reports, Goldman priced the share bonus at Firday’s Goldman closing price of $154.12, which represents an 8.1% two-day slide in the stock price, in essence awarding Goldman employees with a comparably higher number of shares. With Goldman already trading at $157, or nearly 2% higher from Friday, Goldmanites have also locked in a short-term capital appreciation to boot.
From ZeroHedge.
Sat 23 Jan 2010
In case anyone isn’t aware of the percentages, the last two days wiped out (and then some) all the gains so far in 2010.
While the S&P has only dropped 5%, it has happened in only 3 days.
I’m positioned for a bounce Monday morning, the three day drop is “too far too fast”. But I don’t expect a bounce to last.
And I consider this the warning shot that good times are over. If there is a bounce, it will likely be short lived. Then we can expect to see lower highs and lower lows… basically a return to a bear market.
When I make observations like this, I like to identify what would indicate that my analysis was incorrect. In this case, if the S&P is able to crawl back above 1150… especially if it is able to do so on higher volume.
Side Note: It’s worth commenting that 1150 was just a hair over a 50% retracement from 1576 all the way down to 666 (the 50% level was actually 1121).
Thu 7 Jan 2010