Mon 25 Sep 2006
I’d like to look at the technical situation in the gold markets and compare the current correction to the market situation back in 2002. Hopefully we can learn something, and maybe even anticipate the direction of the gold market a bit… I’m not going to cover the fundamental story, or why we want to own gold… that’s a topic for another post…
There are many a gold bug that think that gold will travel in a straight line — straight up! They buy at any price, and expect the world to fall apart on any given day. It would all be a lot easier if the price of gold moved in a straight line, but alas, we have to deal with reality here.
Price changes in gold can be violent, and it’s incredibly painful as you expect prices to go straight up, when in reality they go down by 21% in a two week period as the HUI index did from 9/11 to 9/21.
Consolidation Periods
Gold, like any market goes through periods of trending and periods of consolidation. Since the bull market in gold began back in April 2001 (when gold was at $257/ounce) there have been some fairly clear distinctions between the periods of bull strength and consolidation.
The way I’ve been looking at it, consolidations typically last 6-10 months, give or take. I consider the length of a consolidation to be the time period from a high-price and when it eventually exceeds that price after some harrowing falls and range-bound trading. We saw a consolidation in 2002 from May to December; in 2003 from February to October; in 2004 from January (or April) to November; in 2004/05 from December 04 to September 05; and now the current consolidation from May 2006 to ???. (See these three charts for some over-lapping multi-year views of what I’m talking about.)
Current Situation vs. 2002
Let’s look just at the way gold and gold stocks performed back in 2002. Gold peaked in late may as the equities markets were just finishing up the patriot rally. After peaking in May, gold consolidated for the next 6 months before breaking out past May’s high in December.
Here’s a chart of gold in 2002, with the chart of 2006 gold prices (to date) lined up beneath it.
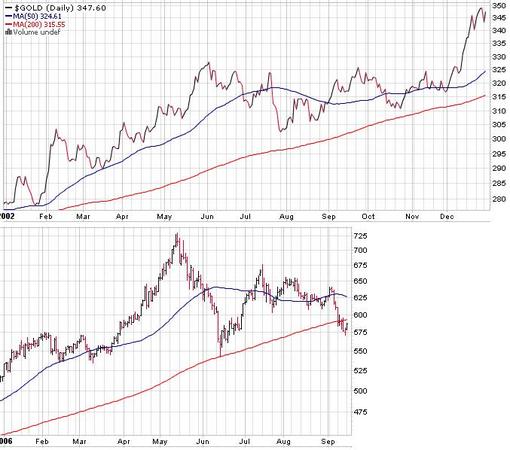
Not too similar, but not too dissimilar either. At the very least, we can see how the two corrections compare to each other. The 2006 correction has been much larger, but also the run-up to the interim high price was much larger.
There are some potential similarities of calendar-based turning points. I’m not usually one for seasonal patterns in non-seasonal securities, but there could be some unseen forces at work. It is not uncommon for gold to bottom near this time of year and rally from there.
In 2002 gold’s nominal price dropped more than 8%, but it looks smaller due to the way continuous contract data is calculated for futures. This year gold dropped a full $180/ounce peak to trough, or 24% from its high. Amazingly, the majority of this 180 point drop simply reversed the price action from the two months leading up to the correction — the June low was the same as the price back in March, only 3 months earlier.
Now, let’s take a look at the same time periods for gold stocks as represented by the Amex GoldBugs Index (symbol HUI).
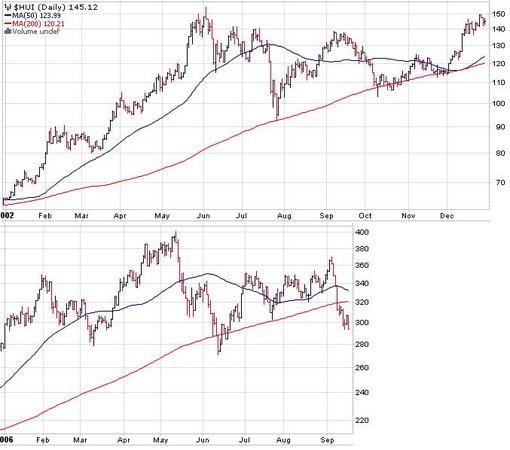
We obviously have a similar pattern with gold stocks since they tend to trade in sympathy with the price of gold. There’s the same peak in May/June and the subsequent correction.
What’s Next?
Are we at the ideal buying point right now? Maybe. There are a few things technically that keep me from answering with a full “Yes”. The main thing is that the yield spread is still declining. We probably won’t see a sustained rally in gold until the trend in yield spreads reverses. Even though the yield curve is inverted, the trend right now is towards more inversion, not towards less.
How does this fare for gold and gold stocks? It looks like the last few trading days may have put in a bottom, though it is obviously impossible to know if this is a relative bottom, or if gold will dip down further before beginning a longer rally. If it was a short-term bottom, we could easily see gold rally for about two weeks before showing additional weakness.
If we were to look at some of the correction periods that I didn’t include charts of, we would see that it is fairly common for prices to “test” the low price during the correction two times. It wouldn’t be surprising if after a 2 week rally gold were to dip down to the $560-580 range before starting an uptrend. Note that the areas of support vary based on which futures contract you look at due to contango (December is higher than October).
Opportunity Setup
Even with additional weakness, we are talking about 5% potential downside for gold (590 –> 560 = 5%) or 8% for gold stocks (HUI 295 –> 270 = 8.4%). This is a small amount to risk compared to the potential upside if a rally does begin from here. From the correction low in May 2005 to the peak this last May, HUI returned 130%.
I consider this to be a great setup for investing in or trading in gold and gold stocks. Your actual trigger for entry would depend on your investing style.
A breakout trader could wait for the gold price to trade above $600. Someone doing broad asset allocation might use dollar cost averaging to start accumulating now and over the next month or two if an additional dip occurs or not. Active traders might take a core position now (in case the price doesn’t correct) and plan to buy more on that correction.
Regardless of how you might trade it, I believe the current situation is an outstanding opportunity when looked at in terms of the risk to reward ratio.
Three Different Scenarios
One important question to answer when considering a trade like this is “what if I’m wrong. What can unfold if this isn’t the end of a consolidation, or if gold isn’t really in a secular bull market? I see three potential scenarios occuring.
1. Gold goes up from here.
2. Gold is in a bear market and goes down from here.
Since we’re close to support (5% and 8%) we should know fairly quickly if we’re wrong and we’d be able to get out with a small loss. Similarly, if we took the approach of the breakout trader and wait for prices to move in our direction (up) before taking a position, our risk should be even smaller.
3. Gold is in a range-bound market and goes sideways from here.
If gold were to trade sideways for longer, we should be buying near the bottom of the channel. This should result in a small profit, though much less profit than scenario #1.
Conclusion
It’s awfully hard to tell which scenario is right. As Niels Bohr said, prediction is difficult, especitally if it’s about the future.
But there are times when you can minimize the risk of a trade. If we’re right, we should make a good return. If we’re wrong, we should lose little, or maybe even make a little.
We’re approaching just such a time now. I’ve held back on commenting on the gold markets too much in the past because timing can be critical, and when the timing isn’t right patience must be exercised. We’re quickly approaching a point where the timing might be right, and it’s worth paying attention to.
I’m guessing that there will be some very good opportunities to buy gold at a great price now and over the next month.
September 25th, 2006 at 8:17 am
Very convincing and well composed argument for gold. I’m sold! I know you’ve been closely watching gold for some time now and I value your opinion. What are your favorite gold blog and info sites? I’m asking because before I get involved in a position, I’d like to know where to get some informative commentary so I can better track this investment and determine exit points (charts are only part of the story).
September 25th, 2006 at 8:20 am
Also, my likely method of trading would be a mixture of dollar cost averaging and obtaining a core position. You made a compelling argument that gold is in a nice setup, so I can see purchasing 50% of the total amount I intend to invest now, and then purchase 10-20% every couple weeks or so (less if gold is going up, more if it’s going down) until 100% of the total investment is made.
September 25th, 2006 at 8:56 am
A lot of people like Kitco, but it makes me dizzy whenever I open the page… their philosophy is that you can never have too much on a single webpage. Gold Eagle is also good and has lots of editorials, though it can be a lot of noise with so many contributors…
Bill Cara is something of a gold bug in the context of his more mainstream investment ideas.
I also like to review the reports from the gold mutual funds Tocqueville (TGLDX) and American Century (BGEIX).
September 26th, 2006 at 11:12 am
Pure Gold?…
In light of Jason’s commentary on gold’s technical picture, I set out to understand exactly why gold has reached this position in an attempt to shed some possible light on how it might act going forward.? My adventure has taken me down so …