Sun 9 Jul 2006
My topic for today’s meeting will be a tactical one, and I hope to answer the question, “How can I limit the risk of the fundsI put into a given mutual fund?”
I use mutual funds for general asset allocation, usually for funds in taxable accounts to minimize taxable sales. (I use my retirement accounts for trading that typically creates holdings of less than 1 year.) At times, I might choose to invest large amounts in a single mutual fund to get to my asset allocation targets (e.g. 20% in international stocks).
If international stocks or gold stocks go down a helluva lot (which they have great tendency to do), do I just accept it as my fate? Not I… So, how do I limit my risk?
Instead, I do some quick analysis of the price history of the mutual fund in hopes of being able to identify risk appropriately.
Let’s take a look at the Oakmark International Value Fund (OAKIX) and look at what we might be able to learn. I downloaded the historical prices of OAKIX from Yahoo Finance, going back to 1993. This is good because it includes several periods where international stocks have been volatile, like the 1998 Russian bond default. I opened the price series in Excel and calculated the drawdown from the highest high that the fund has ever made and charted it here:
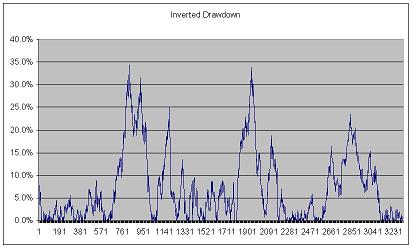
I used the adjusted price in my calculations, so dividends are factored into the price. Also, the time scale is inverted (I didn’t bother trying to fix it in Excel) — 1993 data shows up on the right, 2006 data shows up on the left.
Now, if we take a close look, over the last 13 years, the funds worst drawdown is 35%. If I wanted to hold the fund and never sell, I could use the 35% drawdown to figure out how much I want to invest in this fund, or at the very least, manage my own expectations for how much the fund could fall and be behaving “normally”.
This is important analysis that most people will probably ignore when buying a “long-term” holding. In addition to looking at the size of the drawdown, we could also analyze the length of drawdowns. The biggest drawdown on the left side of the chart (from 0% to 34% and back to 0%) took 18 months to play out. This probably contributes to the conventional wisdom that “you need to have a 3+ year timeframe for your stock investments”. A drawdown could easily last 1-2 years, and it sucks to sell at the bottom of a drawdown.
Instead of buy and forget, I’m more likely to look at what a more reasonable threshhold might be… Most of the times that there was a drawdown, the drawdowns stayed under 10%. There are several times when the drawdown went well beyond 10%, but they usually happened before a drawdown over 20%.
So, with this basic analysis in place, I’m using a stop-loss of 10% on my holdings of OAKIX (adjusted for dividends). If I’m wrong and a drawdown reverses after I’ve sold, I’ll certainly consider reinvesting.
Obviously it would be good to catch the rebound from the peak of the drawdown all the way back up while the fund is making new highs… This post looks in detail at the analysis of one of my exit rules. I’ve ignored the entry rule — why I wanted to buy international value in the first place, as well as the criteria for re-entry if I decide to re-buy after the exit rule gets me out of a position.
This analysis was applied to an actively managed portfolio of stocks, but we should be able to apply the same analysis to indexes like the S&P 500 or to individual stocks or even commodities like Gold.
Likewise, we shouldn’t just stop the analysis at OAKIX — it could have just been a lucky survivor during previous downturns in the sector. I would likely continue this investigation with other mutual funds that are internationally targeted, as well as any indexes (like the MSCI EAFE) that it should behave similarly to.