Fri 21 Jul 2006
As soon as I saw the chart in Jason’s post, I could tell there was a profile story there. I’m getting better at “seeing” the profile in a barchart. Here is the 90-minute profile for copper futures:
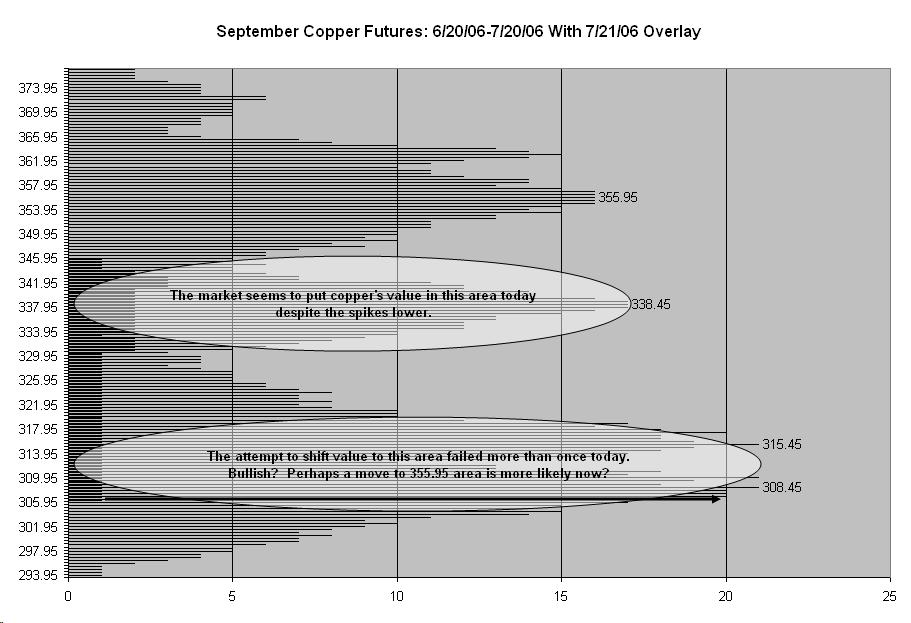
Once again, we see a market bounce off of a predetermined area of high past density and you can also see the day’s preference for hanging out in another area of high density. You can see three clear areas that cooper prices have moved between in the past month. One way of thinking about this is that copper has really had only 3-4 values all month and everything else was just a journey between them. Like an auction, there are bids that lead up to a market value, sometimes overshooting or sometimes stealing a great value. Some overpay, some underpay. But most bids came in at three distinct areas. Certain prices tend to bring bids more often: the price the market thinks is probably fair value. It’s nice to be able to ignore all the zig and zag and reduce it down to 3-4 numbers and where the market is in relation to those numbers.
This is a wild guess but it looks like smart money may have found a great opportunity to buy cheap and probably stocked up hard and fast, causing the quick move back to value.
The rejection of the lower region we saw today is similar to someone bidding based on a previous auction result they saw on eBay, only to find that times have changed and “true” price demands much higher bids.