Tue 26 Sep 2006
In light of Jason’s commentary on gold’s technical picture, I set out to understand exactly why gold has reached this position in an attempt to shed some possible light on how it might act going forward.? My adventure has taken me down so interesting back alleys to say the least.? I began by pulling out the Commitment of Traders reports from the CFTC.? I’ve been studying these reports more and more lately and now I had an excuse to do a more concentrated study on one market.?
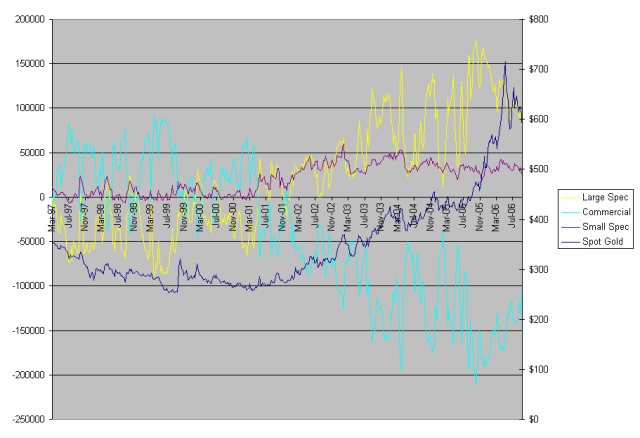
If you aren’t familiar with the COT, it is a weekly release (delayed by one week) summarizing all open positions in the futures markets, i.e. the open interest.? It breaks the open interest down into non-commercial traders (large speculators like hedge funds that must report their activity), commercial traders (dealers and industry insiders who hedge and must also report) and the “rest” (the small, unreported?trader like you or me).? These are further divided into long and short and the sum total of all of these adds up to the net of 0 that you would expect, since every trade has a buy and sell side.? Here is a quick?chart of the COT data for COMEX gold futures that I grabbed off of NowAndFutures:
 ?
?
As you can see, the commercials have recently?taken a constant net short postion, which is likely a hedge to actual or future physical holdings (think about a gold mining company) and the “Large Spec”s are your gold ETFs and index funds etc.? But the commercials are also the dealers who feed the speculative buying.? Somebody has to be willing to go short.? The yellow guys are us and, as you can see, we aren’t crap in the big picture.? Now the response by most people seeing a COT report for the first time is usually, “Holy shit!? I just found the holy grail!? If I know what the big money is doing then all I have to do is follow it.”? Not so fast.? First of all, everyone already knows about the COT.? Next, there is still a lot you don’t know because a big part of the picture is missing: the acutal supply and demand influences.? For example, commercial buying is a mix of producers and users of gold with different motives.? Selling could be profit taking or it could be increased hedging.? Buying could be?profit enhancing or?inventory building.? Only they know what’s going on with the gold.
I could talk all day about how to read a COT report and still not get a tradeable idea out of it but that doesn’t make it useless.? Like most technical indicators, extreme values or historically unusual situations often lead to opportunity.? A trader must look at thing in several dimensions at once (open interest level, net commercial positions, price behavior, volume) and figure out how they all fit together in a story.? Not easy.? But back to gold and those dark alleys.
One interesting area of the COT report is a section called “Percent of Open Interest Held by 4 or Less of the Largest Traders”.? Yes, it says “4 or Less”.? In fact, if you can wrap your head around this, there are only 222 total traders that make up Commercial/Large Spec for the COMEX gold futures.? 222 traders control positions that amount to 35,585,200 Troy oz. of gold.? To put that in even more perspective, there is estimated to be ~80,000,000 Troy oz. of gold supply produced each year in the whole world, so that’s about 44% of the world’s gold?production being bandied about by 222 really rich dudes.
But back to the “4 or Less” really, really, really big dudes.? And keep in mind that “or Less” means that it could very well be 1 and is intentionally vague.? What you can learn from these numbers is a little bit scary.? When markets are big it’s not a problem if they are well dispersed.? But if a position gets concentrated in a few hands you possible market manipulation.? Now, understanding how this works in difficult so I’ll quote from various resourses around the net that describe this kind of behavior.
The key for the dealers is that they know how the technical funds and other technical traders will behave at certain price points. The dealers know that technical traders buy as prices are rising and that they sell as prices are falling. Armed with this knowledge and the fact that only 8 or less dealers control the entire net dealer short position in gold and silver, it is easy for the dealers to dictate the technical funds? behavior.
Since there are so few dealers holding a very concentrated short position, It is no problem for the dealers to collude and tacitly agree to withhold offers to sell more short positions as the tech funds are buying with abandon. This assures that the tech funds buy at a high price. Once the tech funds are positioned on the long side, the concentrated dealer short sellers pull the rug out from under the tech funds. The dealers then collude and withhold bids until the tech funds begin to sell in a panic. The dealers are real pros (if that term applies to criminals) in that they know just when to effect their collusive activity, i.e., when the markets are thin, such as overnight. This assures the most dramatic price movements, up or down.
So having the picture painted for me as to how these situations can arise, I decided to create?some visuals of the markets that can demonstate that this kind of behavior may well be behind the recent drop in gold (and who knows what other commodities).? This will let us see if a concentrated few?were biting off more than usual in the face of rising gold prices.
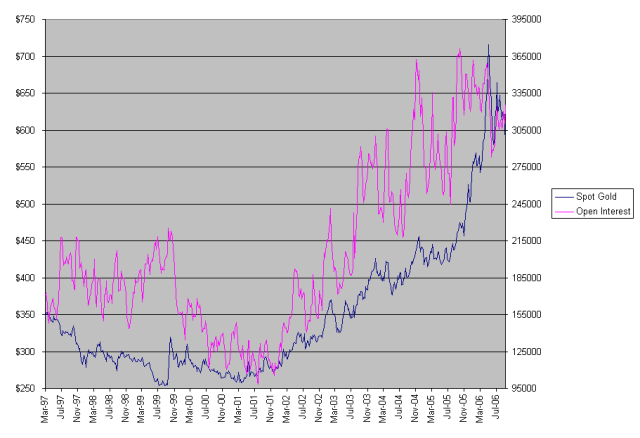
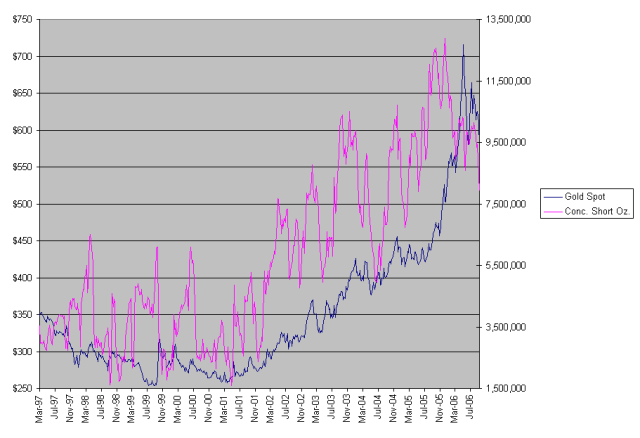
The first image shows the open interest in gold futures.? As you can see, as the bull started to run, interest in the market became increasing enormous.? This was also seen in the expanding?chasm on the COT chart.? So more and more positions and more and more commercials getting short.? Now the second chart shows the Troy ounces (100 x open interest) of net short gold concentrated in 4 or less large traders.? Note the 9,500,000 level.? Do you know how much gold the COMEX actually has on hand in warehouses?? Only 7,984,666 oz.? Talk about delivery problems.? Very few other markets (silver is even more so and the connections shouldn’t be lost on you) demonstrate this intense level of concentration on one side of the game.? The ability to play out the scenerio described above is almost too easy.? 1-2% of the traders have 30% of the net short position.
Seeing something like this makes me wonder if I want to be in this market at all knowing that at any moment the concentrated shorts will try to ease some of the pressure by playing games with the greedy longs.? But then again, the longs were still able to capture huge games over the past few years.? Isn’t that worth some pain?? That said, there does seem to be some significant pressure released on these recent down moves.? I note with interest that the first downleg didn’t provide nearly the relief?of the latest.? This adds more support to this being a good time to buy.
So why didn’t the shorts act before now?? Perhaps it has to do with need the right level of greed/fear in the longs for it to work.? Maybe they need that parabolic move or maybe they just know something we don’t.? But the fact remains that you need to keep a watchful eye on these guys when you are in this market.? It isn’t always as simple as sell when they get concentrated (which is relative anyway) because you’d probably miss some good moves.? But ask yourself this question: where would price be if the big commericials could somehow (not likely) find enough longs to switch sides and light their load?
?
September 26th, 2006 at 12:09 pm
Thanks for contributing to the discussion… I will have to look at the COT reports more closely.
One thing that could contribute to the size of the short position is the hedge books for the major gold producers (like Barrick). I’ve seen Barrick (ABX) referred to as a “a hedge fund in drag” due to the amount of derrivatives they put on, but I’m not sure how big it is in comparison to the COT numbers above.
Good material for further research…