Wed 11 Oct 2006
I read a while back that there is a 4 step hierarchy in terms of what drives markets. The first step is liquidity, then flow of funds, sentiment, and microstructure indicators (i.e., microeconomics or technical analysis). The basic idea is that everything flows from liquidity, and that liquidity is the largest of all influencers. The liquidity environment (expansion or contraction) is the mother-trend and is the “rising tide that raises all ships” when expanding.
I decided to take a look at liquidity trends over the last few years, and maybe in the process compare the current environment to the last (only) soft landing in 1994 as well as the recession in 2000.
The most common way to monitor liquidity is the yield curve; the most commont way to monitor the trend in liquidity is by looking at yield spreads. The most common yield spread seems to be the difference between the 10 year treasury yield and the 3 month treasury yield. You can also look at the 30/3, the 30/5, or various other combinations, but I will stick to the 10/3 since that is what the Fed seems to focus on with its own work.
The changes in the yield curve are a byproduct of the changing liquidity environment, but because of the size of the bond markets it is fairly reliable. While it has been a useful indicator in the past, it is possible that something has changed recently that will alter the behavior of the yield spred (e.g., the structure of the credit markets, or the decisions of foreign central banks). Despite this possibility, it is most likely that we will see changes in the liqudity environment reflected in the yield spread.
A falling value on the chart of the yield-spread indicates liquidity expansion as the yield on the 10 year gets closer and closer to the 3 month. Inversion occurs when the value on the StockCharts graph is below 1.0. A rising value indicates liquidity contraction. Liquidity expansion means more credit, more spending in most areas, and generally rising assets (typically in a subset of sectors, not necessarily across the board). In the current hedge-fund driven markets, expanding liquidity also means expanding leverage.
First up… let’s compare the yield spread behavior now to the 1994 time period. The charts cover an 8 year time-frame, so you’ll have to click on them to see the detail. I chose to subtract the 3 month yield from the 10 year spread, so these charts invert when the value drops below zero (at StockCharts the inversion happens below 1.0).
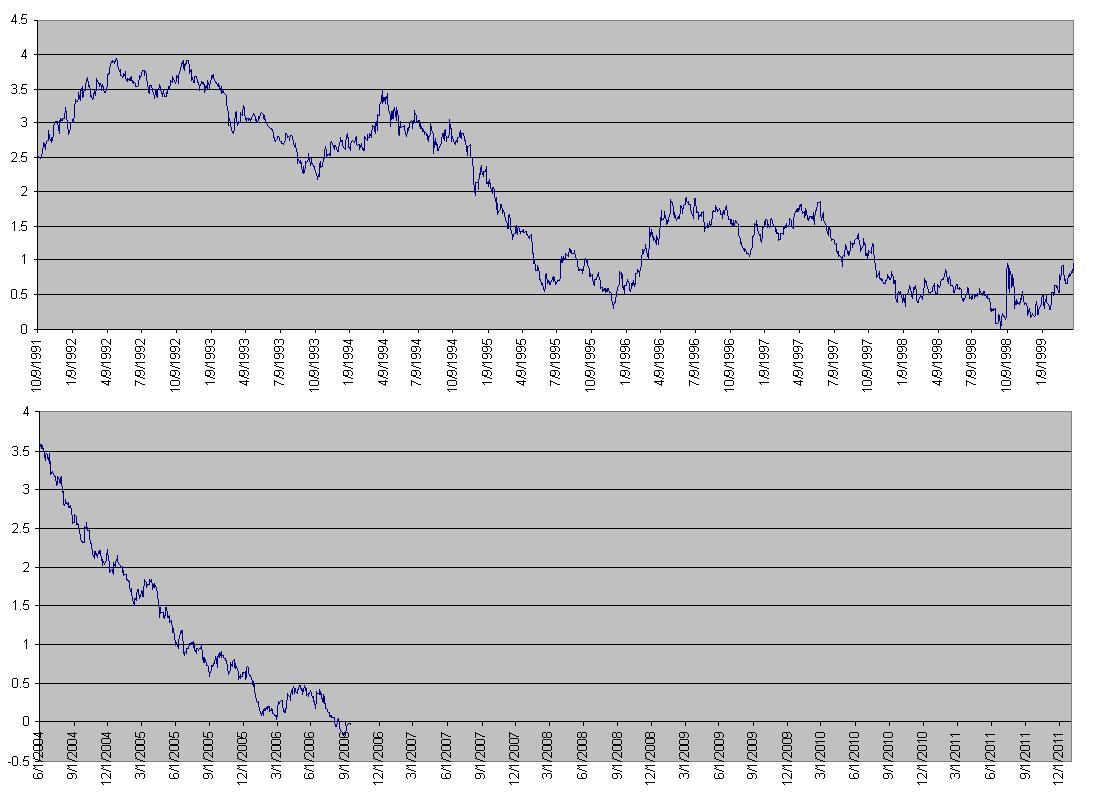
You can see how around Q4 of 1993 there was a reversal in the spread from 2.5% to Q2 of 1994 with a value of 3.5%. This was the “short” period of contracting liquidity that would have preceded a recession had one officially taken place. At this scale it is “short”, but for the 9 or so months of contracting liquidity it probably felt like a lifetime for market participants.
The expansion of liquidity leading up to the soft landing resulted in the yield spread dropping from 4% to 2.5%. The spread then contracted back from 2.5% to 3.5%. After the contraction, liquidity expanded further until it bottomed in late 1995, and for the most part the spread stayed low (beneath 2%) for the rest of the decade.
Now let’s do a similar comparison to the 2000 hard landing in terms of the yield spread and collapsing liquidity.

In this case, we saw the spread expand dramatically just before the recession in 2001 (officially from March 2001 to November 2001). The spread reached an inversion of -0.76 before turning upward. Also noteworthy is the fact that the spread remained inverted (below 0) for ~6 months.
Today we have an inverted yield curve, but it is “barely” inverted. Contrasting this to the soft-landing scenario in 1994, the spread at that time didn’t even get close to being inverted — the spread stayed above 2% until the beginning of 1995.
In 2000 we saw the spread drop from ~1.5% to -0.75%, a 2.25% decline. In 2006 we have seen the spread drop from 4.0% (the high, not shown to the left of the chart) to basically zero. We can also note that the 2006 spread decline is somewhat distorted from the ultra-low Fed Funds rate of 1% in 2004 (the Fed Funds Rate basically sets the 3 month rate).
So, what does it all mean? I think the comparisons to the 1994 soft landing are interesting and compelling. If we do have a soft landing, that means that we will see the yield spread stay at or near zero for a long time (the length of the next business cycle). This could provide some very interesting conundrums in the bond markets for years. As for the counter-argument, rates have fallen further in 2006 than in the early 90s, and there is less room for the yield spread to fall further during the next economic cycle.
Comparing the current situation to the environment in 2000 is also interesting. We see an inverted yield spread in both cases, but in 2000 we saw that inversion last 6 months, with it increasing in inversion the entire time. This implies that we could see the spread stay inverted through Q1 2007 without being unusual.
One other observation that is worth noting… the yield spread seems to trend fairly well, just like a traditional market. We can see very long term trends persisting for long periods. Just like any other trend, we should watch for the trend to change direction before calling it over. Right now, the trend is down (liquidity expansion) and the equities markets seem to agree that expansion is the current theme.
Until we see the yield spread actually change direction with conviction, the bull market in liquidity is still in force. Even if we have another situation like 2000, we could have another 4-5 months of inversion without deviating from recent history. Keep the yield spread on your watch list, and be wary when the trend changes to contraction.