Sat 30 Dec 2006
Here’s a different look at the current rally in the Dow Jones Industrial Average, thanks to www.chartoftheday.com. The rally being measured by the “you are here” dot is the Dow’s ascent since 2002.
On the x-axis, we have the length of the rally in days since the rally began.? On the y-axis, we see the percentage change during the rally.
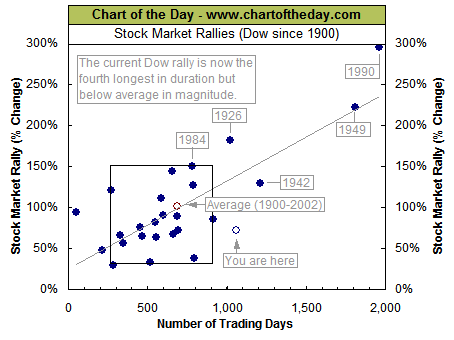
The thing to note is that while the current bull market has lasted longer than all but three bull markets, it pales in the returns offered compared to previous bull runs.
The returns from traditional investments (stocks, bonds, etc.) have been lower in the last several years compared to historical norms. This fact could be easily used by the bullish crowd as an explanation for why more upside is possible from here, but I side with the bearish / cautious… Current returns are being suppressed by an oversupply of credit/money chasing return, and it will take several years for earnings to catch up with valuations. It’s the old story of oversupply and waiting for the oversupply to be worked off…