Sun 5 Aug 2007
Quite a while ago, we discussed drawdown analysis for mutual funds, and how understanding drawdowns can help in setting properly positioned stop losses… With two of my mutual funds dropping down against their stop loss levels, it’s time to revisit the analysis.
We’re looking at OAKMX and OAKIX, both long term value oriented mutual funds run by Oakmark Funds. OAKMX focuses on large cap value; OAKIX focuses on large cap international value. Here are the 3 year performance charts of the two mutual funds:
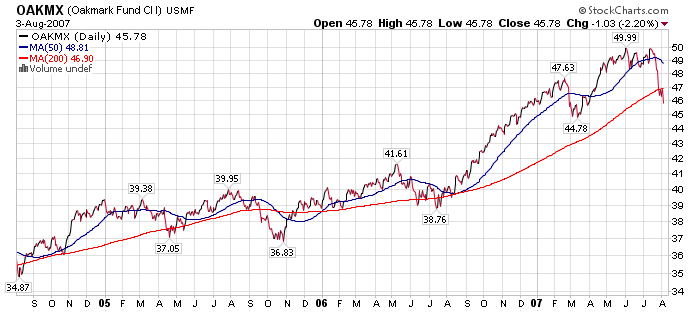
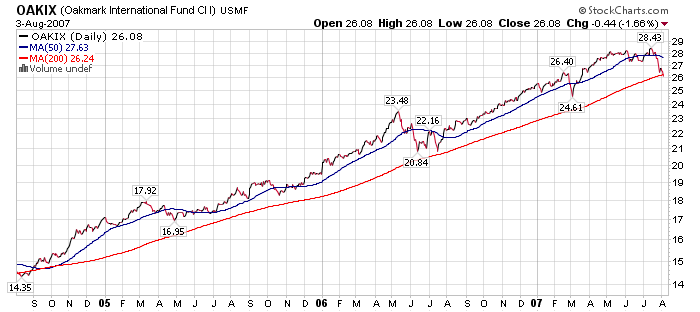
Wow, good runs on both funds. Unfortunately, the dips on the right margin are 8.42% and 8.27% drawdowns respectively. Here are charts of the drawdowns in these funds since the early 90s.
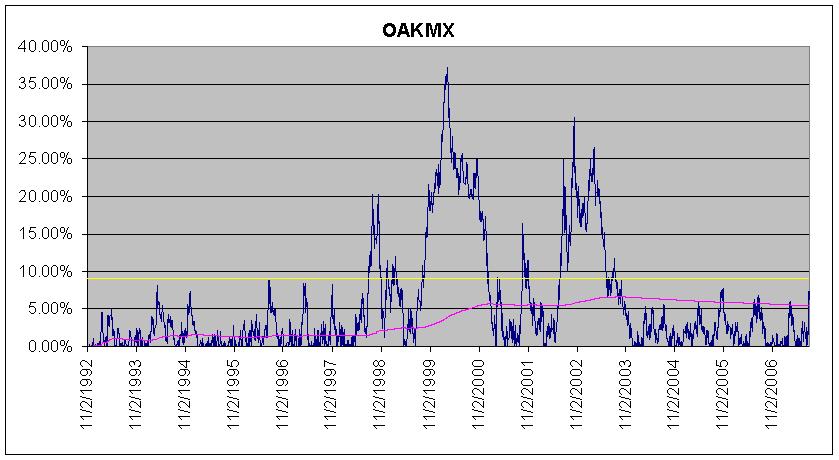
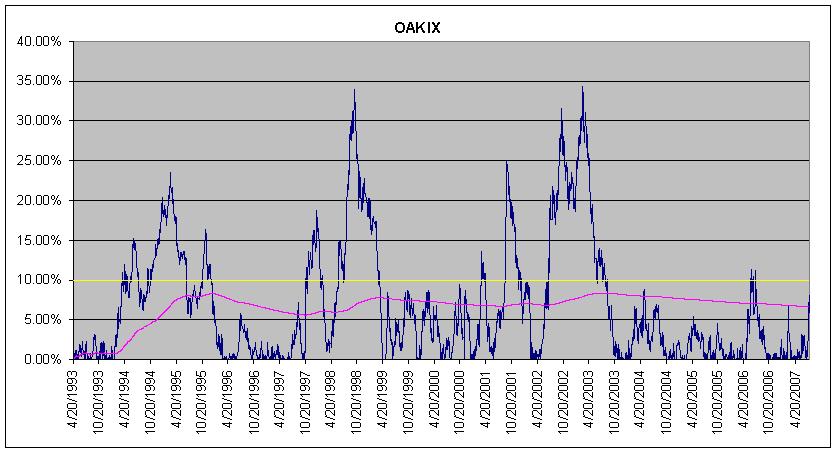
The blue lines are the drawdown percentage (inverted so the values are positive) of the price of the funds relative to their all-time highs. The pink line is the average drawdown over time, the yellow line I will explain in a few paragraphs…
In both cases, their drawdowns are about average for “normal” pullbacks, though a couple more percent in either one would push it into a danger zone where I feel I would be at risk of losing as much as 35% of the money invested in these funds.
I am giving the funds a little more room to wiggle, and the yellow lines on the chart are the approximate positioning of my stop-losses, or where I will start to consider selling these funds.
Besides price action, I have to be conscious of the tax implications. Both of these funds have been long-term holdings for me, so they should benefit from lower capital gains tax rates. Additionally, if one were to believe that capital gains tax rates could be rising soon (were the Democrats in power), one might be more inclined to sell now and benefit from the lower rates before they rise…
August 5th, 2007 at 4:22 pm
I’d sell only if you believed that you can effectively park your money in cash and time when to re-enter the trade. Since you are in OAKMX and OAKIX for the long-term, that implies that you plan on holding these (or similar) positions with a portion of your portfolio in the years ahead.
Some items to consider:
* If you sell these and go into cash or another investment vehicle, how will that affect your asset allocation? Will the sale of these funds trigger additional sales elsewhere to ballast your market move?
* Changes to the tax code will be announced well in advance of them actually being implemented (debates in Congress are not only televised but drawn out and well publicized), and the low hanging fruit that the Dems will likely focus on involve repealing Bush’s tax breaks on those in the 35% bracket, estate taxes, and most especially tax breaks on corporations. There hasn’t been much talk of touching capital gains tax, and rightly so since this would be really unpopular with the baby boomers who are expecting to begin tapping their retirement accounts. If anything, expect the boomers to begin clamoring for a decrease in long-term capital gains taxes and with the might of the AARP behind them, they just might get it.
* What about taking advantage of the dollar-cost-averaging effect for the next few months and make steady PURCHASES of OAKMX and OAKIX to take advantage of the recent (and probably continuing) downturn. This purchasing strategy best matches your long-term strategy and allows you to obtain these two funds at discount prices (especially if you are considering holding these positions for 5+ years). Granted, the fund might slide further downward, but each month you’ll be getting more for your money and you can opt to not buy more should the fund snap back upwards.
August 12th, 2007 at 12:33 pm
Good advice, but you’re making one critical mis-judgment… I don’t have the same asset allocation strategy as you do. I don’t mind holding large amounts of cash, and I believe cash is the largest under-appreciated asset class (and coincidentally, the most in demand right now).
Additionally, my “long term strategy” is not to dollar cost average or be fully invested, but to survive until the next real bull market with as many funds intact as possible. That means limiting risk on all fronts, tactically dealt with by using stop losses.
(NOTE: That doesn’t mean I avoid risk all together by avoiding the markets, but I keep a strict control on it by refusing to lose more than, for example, 10% on a given investment.)
I don’t believe buying now constitutes buying these funds at discount prices — they very well could have been overvalued by 10% on July 1, and now are only fairly valued. The price is 10% lower, but that only describes the price, not the value or the spread between the value and price.
Prices have less to do with the value of the companies in the market (future stream of earnings, etc.) than one would normally think. Instead, they’re driven to great extent by liquidity, overarching P/E expansion and contraction, inflation, interest rates, leverage in trading accounts, outstanding float and corresponding investment demand, sentiment and fads, and a few other things I’m forgetting at the moment.
The Fed may be able to bail the markets out of the current credit crunch, but I have a plan in place in case there are adverse consequences that affect my investments.
August 12th, 2007 at 3:33 pm
Some additional fodder for thought…
Oakmark Select’s 2Q Commentary
Oakmark Select has gotten hit by WaMu’s fall, as well as bets on homebuilders. While I might not disagree with those investments, if I were to make them myself, I am nimble enough to get out without moving the market. Not so for Oakmark.