Tue 5 Aug 2008
Via The Big Picture’s guest post by Pleur de Plessis:
Richard Russell (Dow Theory Letters): Message to foreign creditors
?We owe our foreign creditors billions of dollars. Furthermore, our foreign creditors already own hundreds of billions of dollars. And our foreign creditors? big worry, among other worries is ? what happens if the dollar really tanks? Foreign holders of US dollars have already lost billions due to the slumping dollar. Yet, above all, the US needs our creditors holding on to their dollars and buying ever-more US bonds. What to do?
?Do you remember Treasury Secretary Paulson rushing all over the world ? Beijing, Moscow, Berlin, Tokyo ? you name it. What was he doing? I think he was beseeching our creditors, ?Look, you?ve got to help us and at the same time help yourself. Hold on to your US bonds, hold on to your Fannie and Freddie paper, keep buying our paper and our bonds. If you don?t, we?re all facing a catastrophe.
??The dollar on a purchasing power parity is ridiculously cheap now. And as soon as possible, we?ll raise rates and that will strengthen the dollar. In the mean time, we?ll talk the strong dollar. And we promise that we will not let the dollar hit the skids. A stronger dollar will help us and help you. Just hold our bonds, hold our paper, and keep buying our bonds. Furthermore, we?ll allow your Sovereign Wealth Funds to buy our assets. Buy all of the US you want. But rest assured, WE WILL DEFEND THE DOLLAR.?
?In my opinion, that was the deal. That was the reason why Paulson was running all over the world with his secret message.?
Source: Richard Russell, Dow Theory Letters, July 30, 2008.
This would argue for a sideways market in the USD, and an end to the continually falling dollar.
In my opinion, it may be a year or two, but the next big trend for the USD will likely be up. Will it be up because of US economic strength? Not really… but rather as the least bad of the global currencies. Europe is more messed up that most people realize (demographically), and they will have trouble maintaining the appearance of unity as the next few years unfold.
Here’s a side-note… take a look at the following chart of the USD index:
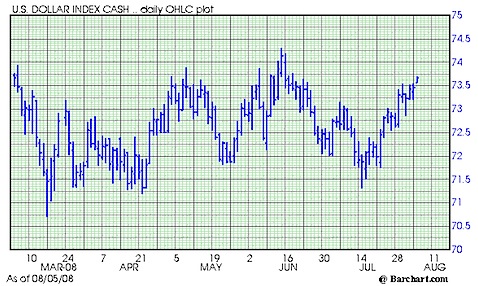
You might notice that the dollar has been rising and falling a lot over the last few months… as if constantly oscillating between extremes. This appearance is a side-effect of the way that charting software works… over the last day or two, the days from February have dropped off the left side of the chart, and the price range expanded to fit the entire graph…
To contrast, here is a 1 year chart where the price range shows a bit more vertical height.
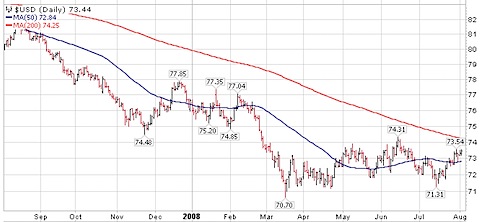
The lesson? Be mindful of your chart axis.
August 16th, 2008 at 6:32 pm
Wow, talk about timing on the subject! I implore anyone who has read my posts about “gravitational value” take a look at some currency charts, especially EUR/USD.