Mon 20 Oct 2008
Paul Kedrosky recently noticed that there are a few notable “bears” turning bullish on the markets lately… Not Roubini or Taleb… but several others, such as Jeremy Grantham (GMO), Barry Ritholtz (Big Picture), and John Hussman (Hussman Funds).
Hussman’s position is typically very well explained in his weekly commentary. This week’s commentary and in this older post, he explains his methodology for using “prior peak earnings” which is the P/E ratio based on the current price and the prior peak of earnings. With this analysis, there’s less worrying about whether forwards earnings estimates are accurate or not… and his timeframe is long enough that prior peak earnings are valid.
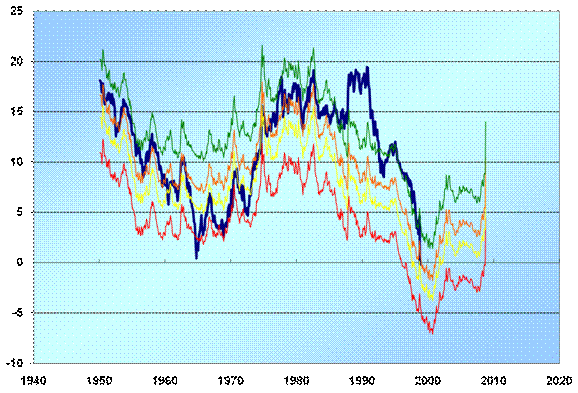
One of the stellar artifacts he points to is his model of expected 10 year returns in stocks (the chart below). It’s a little complicated, but he basically takes a 6% earnings growth rate, the current P/E ratio, and 4 different ending P/E ratios for a 10 year projection. The green line is the expected annualized return over the next 10 years if P/E ratios end in 2018 at 20. The red line is an endpoint of P/E 7 in 2018.
The dark blue line is the actual 10 year return… so it stops in 1998 in the chart below (1998 is the most recent point in time when we can calculate the return of the stock market for the next 10 years).

Drink it in for a minute and think about how the real return managed to hug that green line (and go above it!) for the 1980 to 2000 bull market…
Hussman has been warning of mediocre returns in the stock market for the last several years, but with the recent and sharp rise on the right side of this chart (higher expected annualized returns), he’s gradually increasing his fund’s exposure to the stock market.
Comments? Critiques? Does a 10 year time frame even make sense?