Mon 3 Aug 2009
I was just reviewing an old post on liquidity analysis, and I thought it would be worth re-visiting the topic with some updated graphs.
First, the context… from that post back in October 2006:
…there is a 4 step hierarchy in terms of what drives markets. The first step is liquidity, then flow of funds, sentiment, and microstructure indicators (i.e., microeconomics or technical analysis). The basic idea is that everything flows from liquidity, and that liquidity is the largest of all influencers. The liquidity environment (expansion or contraction) is the mother-trend and is the ?rising tide that raises all ships? when expanding.
…A falling value on the chart of the yield-spread indicates liquidity expansion as the yield on the 10 year gets closer and closer to the 3 month. Inversion occurs when the value on the StockCharts graph is below 1.0. A rising value indicates liquidity contraction.
Here were the two charts presented in that post:
Now, on to the current situation. Suffice it to say, we’ve experienced quite a liquidity contraction, with interest rates dropping like crazy.
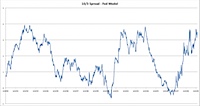
Let’s first look at the last 20 or so years… (click for detail)
One quick note — the post in 2006 was written with yield spread inversion in mind. As we can plainly see, that inversion did not last long (6 months?), and the resulting rise in the yield spread obviously corresponds to the vanishing liquidity that we have endured since then.
It’s very interesting to note that the current spread between the 10 year and 3 month yields is back up to the same approximate levels as in 1991 as well as in 2001-2004, certainly both times of economic stress. Is this a natural stopping point for the yield spread? I’m not sure, but it will be interesting to watch. An argument could certainly be made that we have gone as far as we are likely to go in liquidity contraction, if things hold to the norms of the past two decades. (Note that any good statistician will tell you a sample size of 2 means nothing…)
Just as when the yield curve was inverted, it is important to wait for evidence of a trend change before passing any final judgement.


