Tue 16 Mar 2010
Yay, the stock market is up, the economy is getting better, and we solved the mortgage problem — all it cost us was a few trillion dollars (ok, more than a few). We’re out of the woods, right?
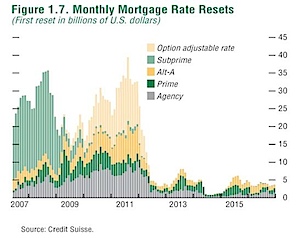
Here is the chart we looked at a while ago with when mortgages with variable rates reset those rates… notice the big wave of green-ish stuff in 2007 and 2008? That’s what we just finished dealing with.
You might also notice that in front of us there is a big wave of yellow-ish stuff in 2010 and 2011. Interesting, no?
John Hussman wrote about this in his weekly review:
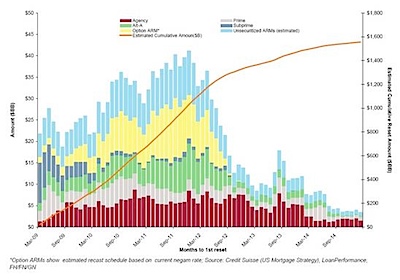
Below is a slightly different schedule we’ve seen. It doesn’t show the first round of sub-prime resets that ended in early 2009, and is based on different classifications, but is largely consistent with the overall profile we can anticipate.
…To reiterate what the reset curve looks like here, the 2010 peak doesn’t really get going until July-Sep (with delinquencies likely to peak about 3 months later, and foreclosures about 3 months after that). A larger peak will occur the second half of 2011. I remain concerned that we could quickly accumulate hundreds of billions of dollars of loan resets in the coming months, and in that case, would expect to see about 40% of those go delinquent based on the sub-prime curve and the delinquency rate on earlier Alt-A loans.
If it cost us several trillion dollars, including nationalizing Fannie and Freddie to deal with the subprime wave of resets, what might happen with the second wave?


August 27th, 2010 at 5:05 am
Looking very relevant now.