Fri 27 Jul 2007
Given that the big news is the big market down day (and, as I write, the aftershock), I figured it was the perfect time to try some of the concepts I learned in Why?Stock Markets Crash. Sornette provides a non-linear model formula that he attempts to fit to markets and notes that when this model finds a good fit, it often does so right before major crashes. This concept relates directly to talks of singularities. Basically, exponential growth, peppered with log-periodic (equally spaced on a log chart but closer and closer together on a standard chart)?waves, results in a singularity or critical time where a crash is highly likely.
There are several parameters that need to be optimized and, since it’s non-linear, it requires some major computation power. All those parameters make it more difficult because, during fitting, you happen upon local minima that?aren’t the real best minimum. So you have to run the optimization several times with different starting seed values and hopefully converge on the answer.
So enter Java. I wrote a program that would read in market data (S&P 500 since the ’03 bottom) and try to perform a fit to the model.?If no good fit is found, you can assume that perhaps we aren’t in a singularity pathway at the moment. If you do get a decent fit, then it tells you? a bubble might be forming and gives you the estimated time for the singularity. It should be noted that by singularity, I don’t mean the big one that is talked about in technology circa 2050. I just mean the end of any greater-than-exponential growth path. In other words, mini-singularities happen, like in 1987 and 1929.
My code is very crude and by no means am I an expert in curve-fitting but I figured it would be fun to see if I could get any good fits and if the various minima would agree on a general time that a major bubble and crash might be likely. Of course, crashes can occur any time but if the precursors of this model are present, you can get a bead on it. Sornette points out that the model gets more accurate as the real time approaches. Modeling too early will give no good results. Also, all those local minima might disagree wildly, leading to inconclusive results. What you are watching for is when all the answer are starting to flash red lights around the same time.
?So is yesterday’s big drop a precursor to a major crash? Has another 1987 started? Well, the answer is: not by Sornette’s model at least. Nothing about the rise in price from the 2003 bottom would lead one to believe that a exponential, log-periodic bubble is in place. The critical times of all the decent fits I could create were years in the future and also all over the map. Here is a chart showing the market data (denoised and coverted to log values) overlaid with the best model:
?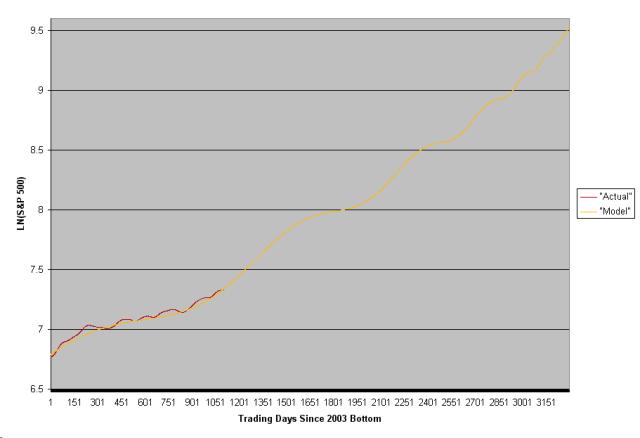
?I’ve extrapolated the model out to the estimated singularity time. As you can see, the best the model could determine was that we are in an early stage of a bubble at best. Please understand that the extrapolation is not saying that that is the likely path. Only that if the market does play out as a bubble, the behavior since 2003 doesn’t reflect it yet. Interestingly, this is in agreement with most value models that show no significant overpricing in the stock market like we saw in 2000.
Crashes don’t need these precursors to happen nor are they guaranteed when the precursors are there (though it is highly likely to a significant degree). Lack of evidence doesn’t equal evidence of lack. But it does mean that a bubble in the mathematical sense that Sornette lays out isn’t?reflected in today’s market as far as my crude code can tell. Take it for what it’s worth.
July 28th, 2007 at 3:29 pm
So, if you took the same code and ran it for the time period 1985 to 1987 before black Tuesday, would you see the model converge right before the crash?
Historical data is here, in case you don’t have data going back that far and want to try it out.
I agree, today’s market turmoil doesn’t seem like it’s the same as previous fragile moments. I’ll probably write a post to explain my perspective on current events…
July 28th, 2007 at 4:52 pm
Yes, the focus of the examples in the book concerns 1928 and 1987. Also, discussed are the Nikkei anti-bubble, several emerging market crashes, currencies and the 1997 mini-crash.
What I need to do however is test my code on those crashes to make sure mine works as expected.
July 28th, 2007 at 8:25 pm
I should add that I’ve done these experiments not because I fully buy the approach laid out by Sornette but to play with a toy more than anything.
Sornette’s approach has many problems, not the least of which is the difficulty of fitting a model, the selectivity of the models for different markets and the lack of detrending the data. He has also flopped on many predictions since his book has been published. He also says that it’s got a high failure rate even if he is right. This makes it more of a novelty than anything and provides some interesting theory that may yet be useful in the vast science of the markets.