Wed 12 Mar 2008
Most of my thoughts about bottoms recently have focused more on the beach-bathing variety I’m starting to see as spring creeps back to the beach. But since everyone is wondering about the market bottom, I’ll bounce the proverbial quarter off of it and see how high it goes.
I’ve talked before about market “gravity” and price clusters that attract future bids. It’s based on basic auction theory: the price that attracts the most bidding represents the best guess at the value of an item even if people who really want the item badly (or are ill-informed or excited) will pay more (or in reverse auctions, less).
I’ve advanced my work on the idea by taking to the computer and working with the R statistical platform to analyze markets from an auction theory perspective.
So how does the?S&P look in this context?Well, I thought it made the most sense to take a snapshot as of the most recent major high, which in this case is 10-17-2007. I went back to an arbitrary 01-01-2005, just enough to make sure that I had prices included well below the recent low. Below is the output?after the close on 10-17-2007. The right-hand panel is a display price on the x-axis and density on the y. Think of density as proportional to the popularity of a price. The dotted lines?mark the?peaks of detected clusters. These are the prices that stand out as most important. The left-hand panel attempts to delineate the clusters. Think of it as the current sphere of influence on price. The same dotted lines appear here. Each black bar corresponds to the range of prices around each dotted line price. When price is in a certain bar, it is most likely testing the value of the associated dotted line. Obviously, there was an attempt to make them mutually exclusive for clarity, but that in no way means they are. Just because price may fall in one cluster doesn’t mean it has no probability of belonging to another nearby cluster.
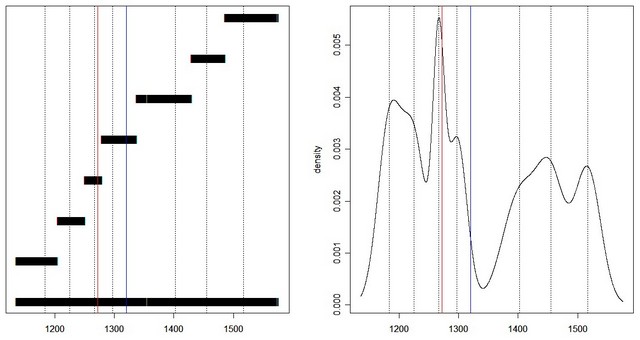
Now look at the red line. That is the recent low. Let me reiterate here that these charts were produced with data only up through the market’s high in October. This fingerprint was already in place as price retraced. While that sinks in, look at the?solid vertical?line. That is the Tuesday rally’s close. Notice that while price move into another sphere of influence, it is still contained in the lower mass of price density. I’ll leave the forecasts to others but a pull back to the read line would be like warm apple pie to the market. It’s familiar and “safe”. Maybe what the market?wants is some time to move sideways in this general area for a while.
I’m facinated that when the fear hit, everyone ran right to the most popular price of the last three years. In some way that makes me feel comforted. Could fear lead to a rational conclusion? Was it mere chance??Maybe. This is just one example pulled out of thin air. But the fact that I didn’t know what I would find but that I knew I’d likely find exactly what I did leaves me a bit breathless…in a good way.