I recently managed to run into a real black swan in on vacation in Hawaii of all places…

Thu 10 Jan 2008
I recently managed to run into a real black swan in on vacation in Hawaii of all places…
Tue 8 Jan 2008
John mentioned a little while ago an opinion that Growth was set to outperform for a while… I took it upon myself to follow up on this fact, and the results are quite impressive.
Comparing the Growth stocks in the S&P 500 against the Value stocks (as defined by the IVW = Growth and IVE = Value SPDR ETFs), Growth is in fact putting in an impressive performance (this is a 3 year view):
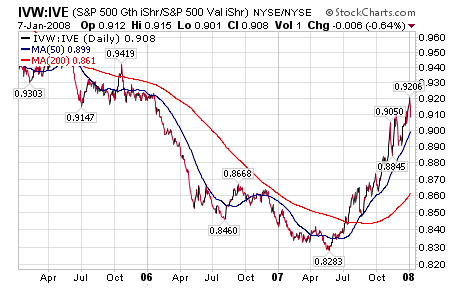
As the growth etf performs better than the value etf, the line rises. Since May of 2007, growth has been on a tear. As a form of kudos, John’s note about Growth outperforming was posted on May 14… right at the nadir on the above graph.
Likewise, Growth is outperforming the entire S&P 500:
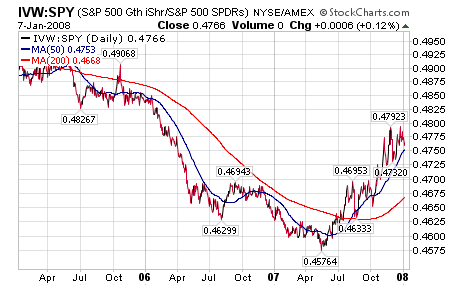
While we’ve seen a few high-flying growth stocks take a beating recently during market dips (see GOOG, AAPL, etc.), these stocks as a group are actually doing quite well. During market declines, the outperformance would take the form of falling less in aggregate.
Sat 5 Jan 2008
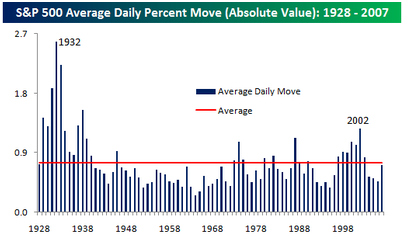
I ran into this interesting post over at the Bespoke website…
While most would agree that the stock market has certainly been more volatile this year, putting it in perspective with the long term trend shows that by at least one measure, the S&P 500 was less volatile this year than its long term average.
The chart below summarizes the average absolute daily price change in the S&P 500 by year. In 2007, the average worked out to 72 basis points, which means that, on average, the S&P 500 had a daily move (up or down) of 0.72% versus an average of 0.75% since 1928. While this year was more volatile than the last three years, prior to those years, the last time the market was this ‘placid’ was in 1996.
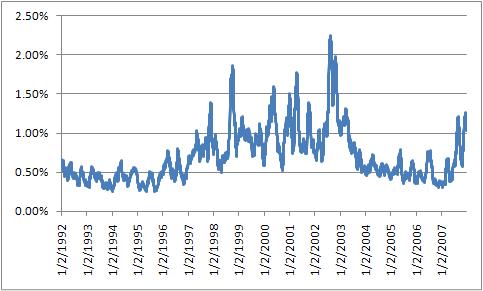
While this is a very good point and good analysis, I decided to do a little of my own analysis and found… I don’t have as much data as Bespoke does. Going back to 1950 (the furthest back I can go with free and easily available data from Yahoo Finance), the average daily change is 0.62%. That makes sense, considering that I couldn’t include the 1930s when volatility was so high.
Despite that, I forged on to find a few interesting things… if I look at the 30 day moving average of daily price change, we get a slightly different picture. The average volatility for 2007 has been skewed lower from the low-volatility of the first 6 months of the year. Outside of the last three years, the last time volatility was this high/low was early 2002 when the markets were mid-patriot rally.
Similarly, it is worth looking at volatility on multi-day time frames, such as weekly price change or monthly price change. As we go to longer time frames, the changes look more similar to the first chart that Bespoke published.
Wed 2 Jan 2008
It is amusing to hear all the gold bulls, and more recently the mainstream media, proclaim that the Fed is “pumping liquidity” into the system. The logical conclusion is that either the Fed is going to ruin the dollar or save the stock markets, depending on who is talking.
But John Hussman has a different take on it… all the “pumping” is simply the roll-over of short term paper lent to banks. Here is a quote from his December 17 commentary:
Last week, the Fed executed the first of its highly publicized ?term auction? transactions. As I noted in A Little Acid Test for Fed ?Liquidity? last week, the Fed had $53 billion in repos outstanding on Friday December 14, fully $39 billion of which were due to expire last week. This ensured that the Fed would initiate new repos of a similar amount. The acid test was whether the term auction repos would represent a) new liquidity, or b) just a different way of rolling over the same money. Last week, we learned the answer to that question is b.
This will be something to watch, as Hussman points out in Monday’s notes:
…on Friday January 4, the huge 16-day 350 billion EUR refinancing from December 19 expires. This ensures that the media will (misleadingly) report a huge apparent injection of liquidity by the ECB on Friday. The question is how huge.
…As for the Fed, a few of the short-term repos the Fed provided for holiday liquidity will expire on Thursday [Jan 3]. Until then, the extra $10 billion or so of repos in the system may put a bit of pressure on the Fed Funds rate, holding it below the target of 4.25% for a few days. The most likely day for any apparent “liquidity injection” will be that same day (Jan 3) due to the expiring repos…
Fascinating stuff, and quite interesting to peel back beneath the headlines about liquidity injection. Hussman recommends going directly to the Fed or ECB’s websites to see the data yourself; see his full articles for links and more detail on the topic.