October 2008
Monthly Archive
Wed 29 Oct 2008
Posted by Jason G. under
Research[3] Comments
I came across a particularly conspiratorial piece of analysis recently that claims that the following 4 statements (used at great length to justify various bailouts) are materially false.
- Bank lending to non-financial corporations and individuals has declined sharply.
- Interbank lending is essentially nonexistent.
- Commercial paper issuance by non-financial corporations has declined sharply and rates have risen to unprecedented levels.
- Banks play a large role in channeling funds from savers to borrowers.
We’ve heard all 4 of these statements numerous times… and if I recall correctly, in sworn statements to Congress…
So, what kind of crazies wrote this paper? The Federal Reserve Bank of Minneapolis. Those f**ing nutjobs.
(more…)
Mon 20 Oct 2008
Posted by Jason G. under
CommentaryNo Comments
Paul Kedrosky recently noticed that there are a few notable “bears” turning bullish on the markets lately… Not Roubini or Taleb… but several others, such as Jeremy Grantham (GMO), Barry Ritholtz (Big Picture), and John Hussman (Hussman Funds).
Hussman’s position is typically very well explained in his weekly commentary. This week’s commentary and in this older post, he explains his methodology for using “prior peak earnings” which is the P/E ratio based on the current price and the prior peak of earnings. With this analysis, there’s less worrying about whether forwards earnings estimates are accurate or not… and his timeframe is long enough that prior peak earnings are valid.
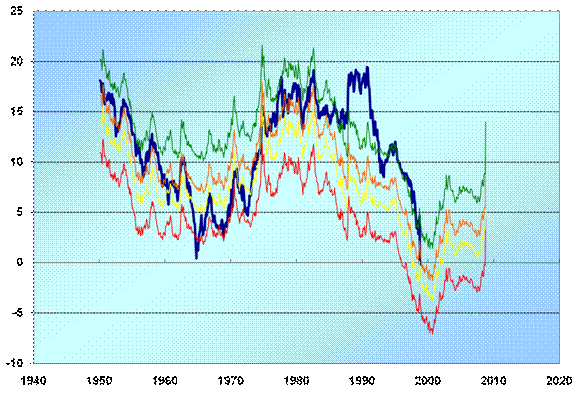
One of the stellar artifacts he points to is his model of expected 10 year returns in stocks (the chart below). It’s a little complicated, but he basically takes a 6% earnings growth rate, the current P/E ratio, and 4 different ending P/E ratios for a 10 year projection. The green line is the expected annualized return over the next 10 years if P/E ratios end in 2018 at 20. The red line is an endpoint of P/E 7 in 2018.
The dark blue line is the actual 10 year return… so it stops in 1998 in the chart below (1998 is the most recent point in time when we can calculate the return of the stock market for the next 10 years).

Drink it in for a minute and think about how the real return managed to hug that green line (and go above it!) for the 1980 to 2000 bull market…
Hussman has been warning of mediocre returns in the stock market for the last several years, but with the recent and sharp rise on the right side of this chart (higher expected annualized returns), he’s gradually increasing his fund’s exposure to the stock market.
Comments? Critiques? Does a 10 year time frame even make sense?
Sun 19 Oct 2008
Posted by Jason G. under
MacroNo Comments
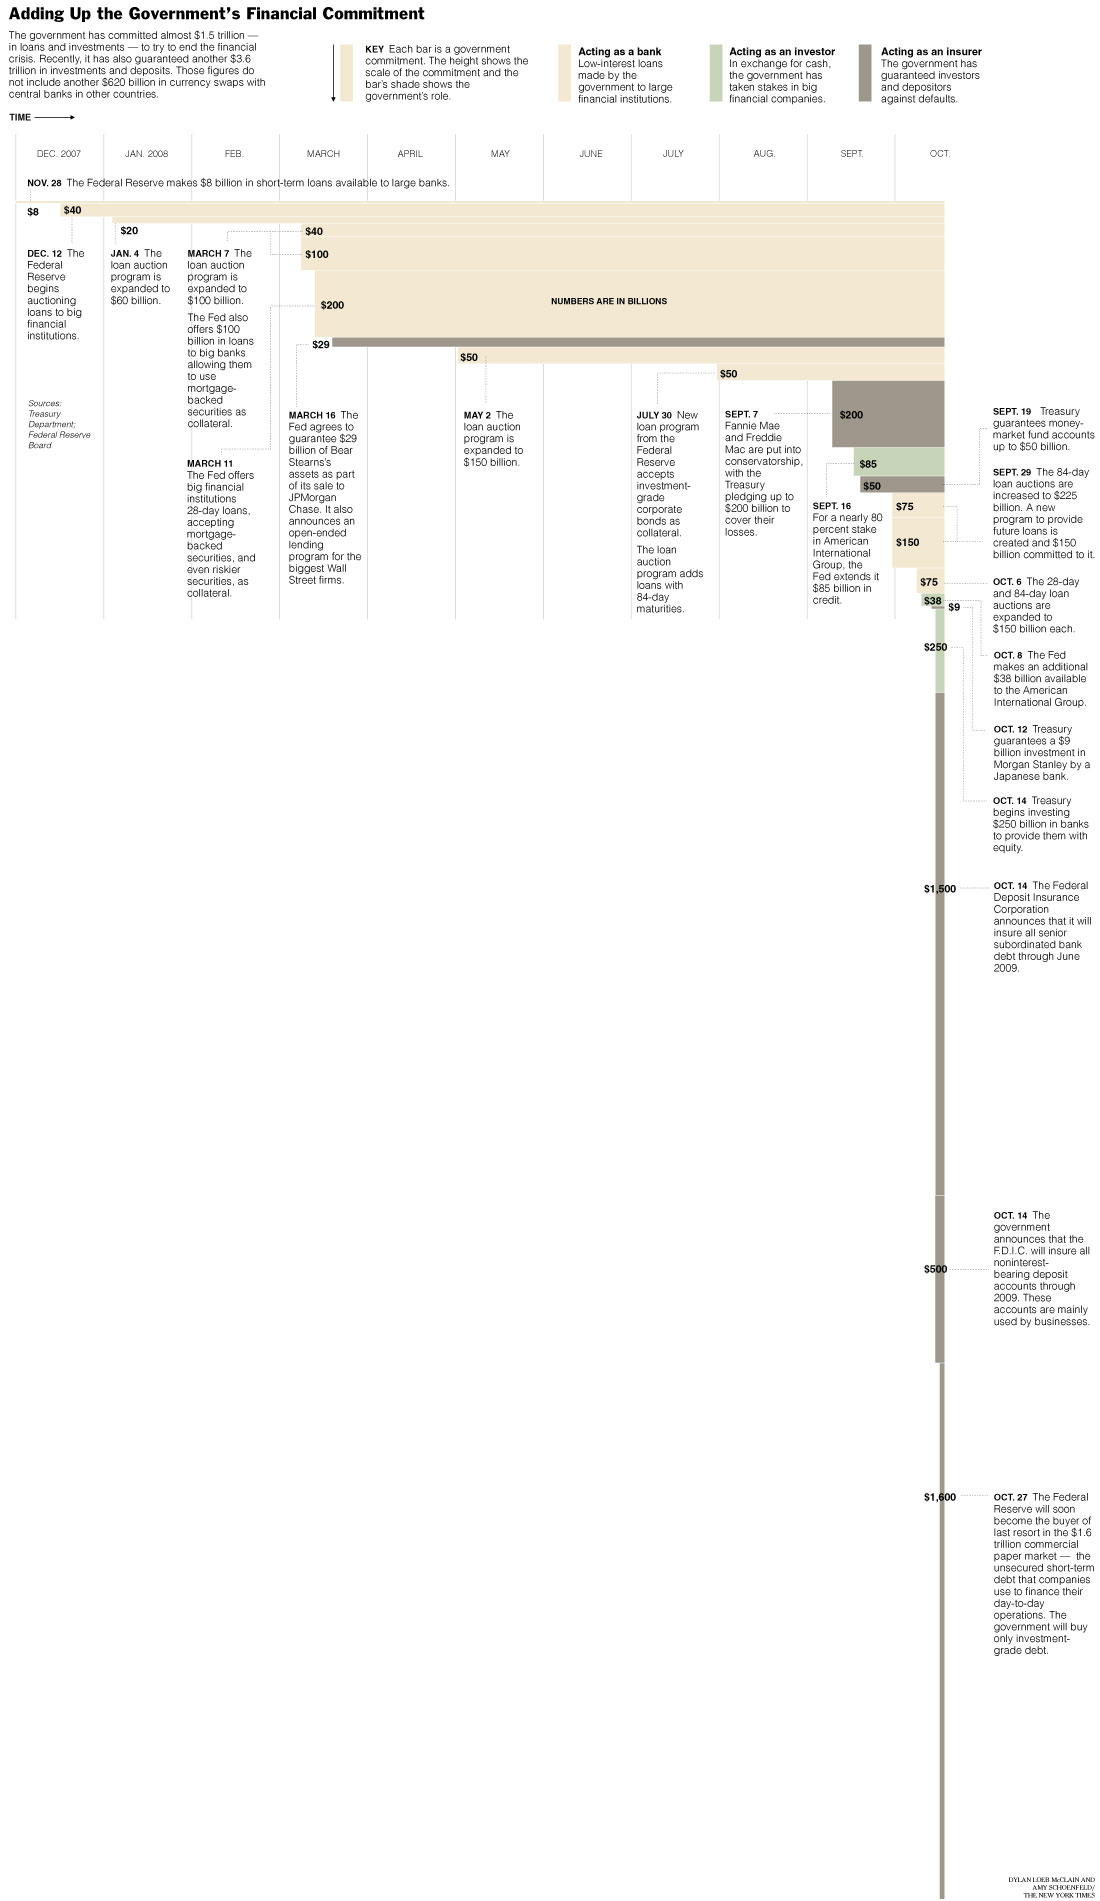
The NY Times put together a little graphical representation of the government commitments over the last year or so…

As many point out, this government profligacy will have a drag on the economy going forward…
Via BigPicture.
Tue 14 Oct 2008
Posted by Jason G. under
CommentaryNo Comments
Stratfor tends to have a good perspective on worldly happenings, and the following quote seemed like it was phrased incredibly well.
The weekend was essentially about this: the global political system is seeking to utilize the assets of the global economy (by taxing or printing money) in order to take control of the global financial system. (more…)
Tue 14 Oct 2008
Posted by Jason G. under
Commentary1 Comment
Making the rounds, from Sinfest:

Sat 11 Oct 2008
Posted by Jason G. under
Commentary1 Comment
You may or may not know about Aubrey McClendon… Duke graduate, co-owner of the Seattle SuperSonics Oklahoma City Thunder, defender of the Duke Lacrosse team (he took out full-page ads in support of the team in 2006), contributor to the Swift Boat ads in 2004, co-founder of natural gas powerhouse Chesapeake Energy (CHK), and multi-billionaire. Forbes put his net worth at $3.1 billion, putting him as number 134 on the Forbes 400.
So, it should be obvious that his net worth has gone down, especially since approximately $2.65 billion of his net worth was in the form of CHK stock… and CHK has dropped from a high of $73 in July to yesterday’s close at $16.50 for a 77% decline.
Unfortunately for Mr. McClendon, Chesapeake has announced that he was forced to sell “substantially all” of his shares in the company to meet margin calls. He’s apparently been buying additional shares of CHK on margin over the years… a strategy that works wonders when things are going up, but wreaks havoc when a bear market occurs.
I’m pretty sure the Forbes 400 will look markedly different next year.
Thu 9 Oct 2008
Posted by Jason G. under
Research[2] Comments
As an FYI to market watchers, tomorrow might be an important day because of the Lehman CDS settlement. I expect it to be a catalyst for direction, though I’m not sure which direction that might be.
Basically, CDS (credit default swaps) are insurance against a company’s debt (bonds) in the event that the company goes bankrupt. Since Lehman officially went bankrupt, the insurance companies (pronounced: banks) are going to have to pay the CDS holders to offset their losses in the underlying bonds.
The rumors are that the CDS settlement will likely cause $360 billion in payment. Notice that MER, BX, and MS were all down about 25% today, potentially in anticipation of tomorrow’s settlement. AIG, JPM, BAC, and GS are probably also involved somehow… you may have noticed the headlines about AIG needing an additional $37 billion loan from the Fed… think the timing is coincidence?
Isn’t de-leveraging fun?
Source: Reuters
Thu 9 Oct 2008
I know PE Ratios are old-school, investor 101, hardly an indicator of much of anything, right? Well, I couldn’t help but see that today the S&P 500 had a PE Ratio of 11.57…. below the PE Ratio it had back at the end of 1988. For reference, PE Ratio of the S&P got as high as 32 (or 46 by some measures) and change in 2001 near the height of that bubblicious time, and the generally accepted PE historical average is 15.
For long-term investment value, a PE this low represents a tasty bargain. Rather than trying to time the market bottom, if you are a long-term investor with 20+ year time horizon, the S&P index is looking pretty good!
Tue 7 Oct 2008
Posted by Jason G. under
Research1 Comment
If you’re comfortable taking on some volatility, you can find some real bargains in the closed-end funds right now.
For example, VVR is a fund that invests in senior debt for corporations. VVR has taken quite a beating in its share price, going from a recent $5 to $6 range to the current $3.70. Here’s the fun part, it’s trading at a 28% discount to the underlying NAV, and is yielding over 14% (as long as the dividend stays at the current rate).
Why such a high yield on a bunch of high-quality senior debt? In a word, panic. If you absolutely gotta get cash, selling a fund like VVR quickly can push the price down dramatically… the daily volume is relatively low, and recent selling has overwhelmed the volume of buyers.
The story is similar with municipal bond fund LEO, with a 21% discount and a tax-free yield over 7%. Compare that to good taxable money market accounts like HSBC Direct at 3.25%, and LEO is looking very attractive.
What’s the risk? High volatility in day-to-day prices, as well as the possibility that some of the bonds held by the funds may default. But as long as you don’t think the world is about to end, these funds are a reasonable investment. (There are other inherent risks to closed-end funds that we’ve discussed before.) Prices could definitely fall further, so as long as the commissions won’t kill your formula, it makes sense to scale into positions over time.
Find more funds like this at www.closed-endfunds.com and do an advanced search. You would also want to look at www.etfconnect.com or MorningStar.com to check the fund’s holdings for anything you’re not comfortable with (several bond funds have FNMA MBS listed as their top 10 holdings…).
Sun 5 Oct 2008
Posted by Jason G. under
CommentaryNo Comments
Hedge funds may not be imploding (at least not yet), but certainly some investors are going to be angry about the returns for some of their “Hedge” funds (as Quicksilver has pointed out in the past, very few hedge funds live up to their name by actually hedging).
The guys over at DealBreaker (a self-proclaimed Wall Street Gossip Rag) have posted a list of letters going out to hedge fund clients, as well as a non-verified list of returns for some of the big boys. Losses range from the respectable (-2.3% YTD) to the ridiculous (-66% YTD).
Every investment strategy has drawdowns and periods when their strategy doesn’t work, so it’s not really fair to point at the returns for this year and make any real conclusions. We will, however, see how well the managers set investor expectations for events like this, as well as whether or not their leverage ratios really factor in all the adverse market conditions we’ve recently experienced.
Next Page »


