December 2006
Monthly Archive
Sat 30 Dec 2006
Posted by Jason G. under
Commentary1 Comment
As the year winds to a close, it is worth reviewing how the different asset classes performed this year… Thanks to the nifty tools at ETF Screen.com, it’s pretty easy to look at the 1 year performance of the myriad of sector ETFs out there…
To start, here are the high-level categories and their returns (yes, I’m rounding):
- IVV (S&P 500) – up 14%
- TLT (US Bonds) – up less than 1%
- EFA (International Stocks) – up 25%
- VNQ (REITs) – up 35%
- GLD (Gold) – up 23%
Amazingly, according to the screener, only 7 of the 240 ETFs are down for the year. (I’m not including funds like SLV that did not exist on 1/1/06.) There are 340 ETFs included in the list, 120 created since January!
Maybe 2006 will be remembered as the year when everything went up at the same time… (more…)
Sat 30 Dec 2006
Posted by Jason G. under Uncategorized
No Comments
Here’s a different look at the current rally in the Dow Jones Industrial Average, thanks to www.chartoftheday.com. The rally being measured by the “you are here” dot is the Dow’s ascent since 2002.
On the x-axis, we have the length of the rally in days since the rally began.? On the y-axis, we see the percentage change during the rally.
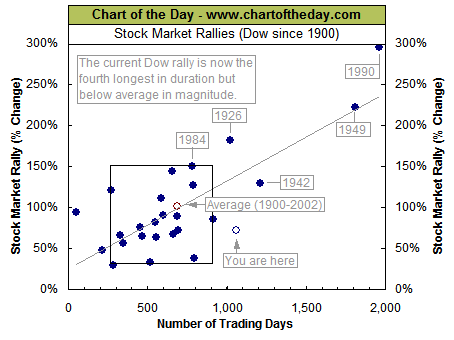
The thing to note is that while the current bull market has lasted longer than all but three bull markets, it pales in the returns offered compared to previous bull runs.
The returns from traditional investments (stocks, bonds, etc.) have been lower in the last several years compared to historical norms. This fact could be easily used by the bullish crowd as an explanation for why more upside is possible from here, but I side with the bearish / cautious… Current returns are being suppressed by an oversupply of credit/money chasing return, and it will take several years for earnings to catch up with valuations. It’s the old story of oversupply and waiting for the oversupply to be worked off…
Thu 28 Dec 2006
Posted by Jason G. under
CommentaryNo Comments
Today’s trading took the Dow Jones Industrial Average past the 12,500 mark. There’s nothing significant about this fact other than the fact that our society uses base-10 numbers and we add significance to round numbers that are divisible by 10 or 100.
That aside, the ascent of the Dow since mid-July is quite breathtaking… nearly a 15% rise since the low point of the year with nary a dip along the rise. There’s not much to add that we haven’t said before, but I figured I’d say it again as we go into the last two days of 2006.
The start of January should be interesting as it is the end of “tax-loss-selling” season and we will see if market participants are eager to buy in the new year or if the enthusiasm is lacking…
Thu 14 Dec 2006
Posted by Jason G. under
Commentary[4] Comments
What happened to my mutual fund holding OAKIX? It’s down 13% today!
(more…)
Thu 14 Dec 2006
Posted by Jason G. under Uncategorized
No Comments
Here’s another unique and compelling ETF… the Claymore/Sabrient Stealth Fund (STH). The stated purpose:
The objective of the [fund] is to actively represent a group of stocks that are ?flying under the radar screen? of Wall Street?s analysts, but which have displayed robust growth characteristics that give them the potential to outperform on a risk-adjusted basis the Russell 2000? Index and other small-cap-oriented benchmark indices.
So they shop for small, good companies that have no Wall Street coverage. The fund is only three months old, but they have a sister index that back-tests the idea several years back.
If you’re an active trader and want some good ideas in the mid-cap range, they also list the ETF’s holdings and update it every day.
Wed 13 Dec 2006
Posted by Jason G. under
Commentary1 Comment
Starting in April, the Internet search company will let rank-and-file staff auction off their stock options to the highest bidding institutional investor, the company said Tuesday. [MarketWatch]
It seems like the Googleplex has found another way to work the markets for every last cent…? By selling stock options in the open market, employees can collect the current value available from exercising stock options, and also collect a time premium for the remaining life of the options.
I’m curious how the SEC will interpret this…
Tue 12 Dec 2006
Posted by Jason G. under
Commentary ,
REITNo Comments
From today’s Dealbook email:
REIT mergers and acquisitions have reached record levels this year. Some 22 transactions totaling $102.8 billion, including debt, have been announced according to the research company SNL Financial, compared with 11 deals valued at $28.8 billion for all of last year and a total of $92 billion in transactions for the last six years combined.
Go to Article from The New York Times
Also noteworthy, Dealbook has an entire section on the happenings in Real Estate M&A for those of you following the REIT story closely…
It seems like the vogue thing today to buy any steady-stream of cash producing asset like real estate (even skyscrapers), leverage to the hilt, package and sell the asset and debt, and in the process reap the rewards. The impact to publicly traded REITs is obvious from a liquidity analysis standpoint (a la TrimTabs) — everything keeps going up!
Mon 11 Dec 2006
It seems that the financial news lately has been full of stories like this (via the FT):
Oil producers shun dollar – Oil producing countries have reduced their exposure to the dollar to the lowest level in two years and shifted oil income into euros, yen and sterling, according to new data from the Bank for International Settlements.
The cover of The Economist last week even taunted a falling dollar: (more…)
Wed 6 Dec 2006
Posted by Jason G. under
Trading[4] Comments
After noticing that CUBA (the closed-end fund, not the country) is trading at a 70% premium to its underlying assets, I started to think about shorting the fund… Here is my thought process and the end result. (more…)
Tue 5 Dec 2006
International stocks were one of the main investment options that many argued you need a top notch manager to effectively invest in. Au contrair! MarketWatch reported in September on a July Standard & Poor study comparing the 5 year returns on International Index managed funds and index funds and this report bears repeating here. Nearly 60-65% of Index Funds outpaced their Managed equivalents. Now the odds are better that you can find an actively managed international fund that outperforms the benchmark than you can find an actively managed US fund that does, but the odds are still not in your favor. An interesting Journal of Financial Planning article from 2002 had found that Small Cap and International Funds outperformed the benchmark index, but this is not reflected in the more recent S&P report.
(more…)
Next Page »