Today is the second time that I’ve found out one of my financial institutions is going out of business, from blogger Mike Shedlock (Mish).
Today’s casualty? Small business credit card provider Advanta. Too bad, they were innovative with their IdeaBlob sponsorship as well as support for Kiva. Unfortunately, when people aren’t paying their bills it is hard to be a credit card lender.
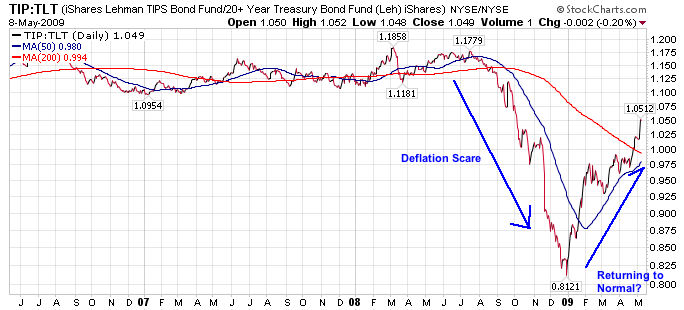
It’s worth revisiting the inflation vs. deflation argument as things have been changing quite a bit over the last few months. Below is the chart of TIP:TLT that is my measure of inflation expectations. Going into the end of 2008, we saw a rather significant deflation scare. Anecdotal evidence abounds for prices and wages falling, and indeed it may be more than just a scare.
You might notice that the ratio has rebounded strongly in 2009, indicating that the investing masses may have a relative preference for TIPs over normal bonds. Despite the message the market is sending (as observed by the ratio), I haven’t heard much rumbling about inflation, except from the contrarian camp.
The real question is whether we’re returning to a “normal” expectation of inflation, or if people are just not as convinced about deflation as they were during the crash of 08.
Obviously time will tell, but if the ratio were to reverse strongly, that would be a good indication of another deflation scare. Likewise, it will be interesting to see where the new trading range is as the market figures out the “new normal”.
Demographics lie behind the major trends in economy, politics, and in the world at large… and this new info from The Wilson Quarterly will certainly drive some big trends in the near future… (Emphasis added by me.)
This stuff fascinates me, so I’m pulling several quotes from the piece:
Something dramatic has happened to the world?s birthrates. Defying predictions of demographicdecline, northern Europeans have started having more babies. Britain and France are now projecting steady population growth through the middle of the century. In North America, the trends are similar. In 2050, according to United Nations projections, it is possible that nearly as many babies will be born in the United States as in China. Indeed, the population of the world?s current demographic colossus will be shrinking. And China is but one particularly sharp example of a widespread fall in birthrates that is occurring across most of the developing world, including much of Asia, Latin America, and the Middle East.
…The decline of Muslim birthrates is a global phenomenon. …recent UN data suggest that Arab birthrates are falling fast, and that the number of births among women under the age of 20 is dropping even more sharply.
The falling fertility rates in large segments of the Islamic world have been matched by another significant shift: Across northern and western Europe, women have suddenly started having more babies.
…In 2007, France?s national statistical authority announced that the country had overtaken Ireland to boast the highest birthrate in Europe. In France, the fertility rate has risen from 1.7 in 1993 to 2.1 in 2007, its highest level since before 1980, despite a steady fall in birthrates among women not born in France. France?s National Institute of Demographic Studies reports that the immigrant population is responsible for only five percent of the rise in the ?birthrate.
…A similar upturn is under way in the United States, where the fertility rate has climbed to its highest level since 1971, reaching 2.1 in 2006, according to the National Center for Health Statistics. New projections by the Pew Research Center suggest that if current trends continue, the population of the United States will rise from today?s total of some 300 million to 438 million in 2050. ?Eighty-?two percent of that increase will be produced by new immigrants and their U.S.-born descendants.
…Russia… within little more than a decade the ?working-?age population will be shrinking by up to one million people annually. Russia is suffering a demographic decline on a scale that is normally associated with the effects of a major ?war.
Just a quick post, I found this website and it looks like a good source of information on Municipal Bonds, specifically buying individual bonds directly rather than via a fund.
Looks like you can search for bonds by state and by type (revenue, callable, etc.). They even have the yield curve for individual states. Seems like a nice resource if you’re interested in investing directly in muni bonds.
I recently watched Eric Rosenfeld’s lecture to MIT students about LTCM and what really happened. Rosenfeld was a partner at LTCM, so he definitely had the inside scoop.
The video is a bit blase if you don’t want to spend an hour and a half listening to an academic talk about why LTCM wasn’t really wrong, despite losing billions of dollars… but it does help the rest of us understand how some of the people in the room actually think about things, and it does carry at least one very important lesson…
Academics ultimately view of the markets in a fundamentally wrong way — at least as Mr. Rosenfeld explains it.
Here’s one of the biggest problem Mr. Rosenfeld doesn’t understand.
Risk is not the same thing as price fluctuations (or the standard deviation of price fluctuations).
In the presentation Rosenfeld makes several comments about how low the risk was in LTCM’s portfolio, for which the evidence was the low daily and monthly standard deviations of the portfolio.
Obviously they didn’t understand the actual risk present in their trades is not the same thing as the price fluctuations. Someone was referring to Rosenfeld’s guest lecture as an attempt at revisionist history, but in reality I think he still misses this fundamental reality of risk.
Let’s imagine that we have a stick of dynamite. It has a long fuse that takes 30 seconds to burn through. Suppose I put on a trade where I hold the dynamite for 20 seconds in exchange for some premium… tossing it into the distance after the 20 seconds.
If I never had my hand destroyed by an errant explosion, I can convince an academic or a banker that there was no risk in the activity. No risk you say? NO RISK. Well, with no risk, we can offer you 10-to-1 leverage on that kind of trade…
So, you tell me… if I take that trade and hold a stick of dynamite for 20 seconds, have I really participated in a trade that has very, very small risk? Does this argument sound familiar? It should, it’s the crux behind The Black Swan, where Nassim Taleb makes a very similar point.
At the end of the day, any time you use leverage you are taking on the risk of failure. Not just of you, but also for your creditor. Take on ridiculous leverage, and you almost guarantee you will bust at some point in time. You guarantee that if/when a crisis hits, you will be one of the weak hands that liquidates. And you will liquidate not based on your own judgement, but rather on someone else’s judgement (the margin clerk’s).
It is difficult enough to trade a multi-billion dollar hedge fund due to liquidity of the funds you invest in… how much more risky is it when you can’t close a position because your leverage makes you a much larger portion of the market you are trading in?
Want a little refresher on what LTCM actually did do? Check the following 6 minute video for a little hyperbole….
I recently read George Friedman’s The Next 100 Years , and was quite impressed by the book… the author recently went on Tech Ticker, and linked below is a segment of his interview where he talks about the challenges China faces and why it won’t be the super-power that everyone else seems to expect.
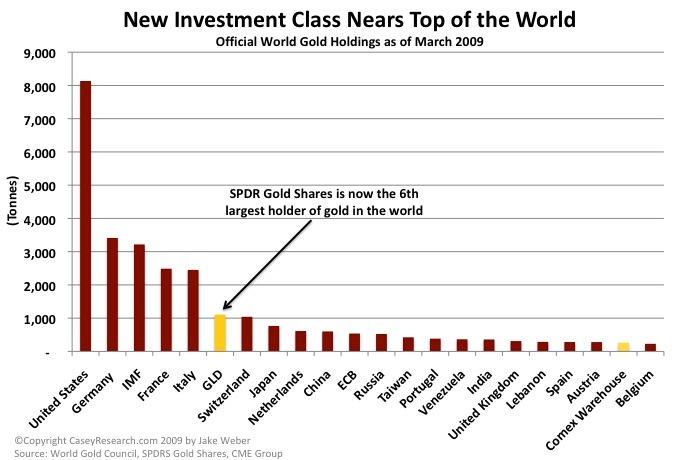
Who is now the 6th largest holder of gold in the world? The GLD ETF:
SPDR Gold Shares (GLD), an exchange-traded fund, first hit the market in November 2004 with 260,000 ounces of gold. Today, GLD is the world?s 6th largest holder of physical gold with over 35 million troy ounces in the vault.
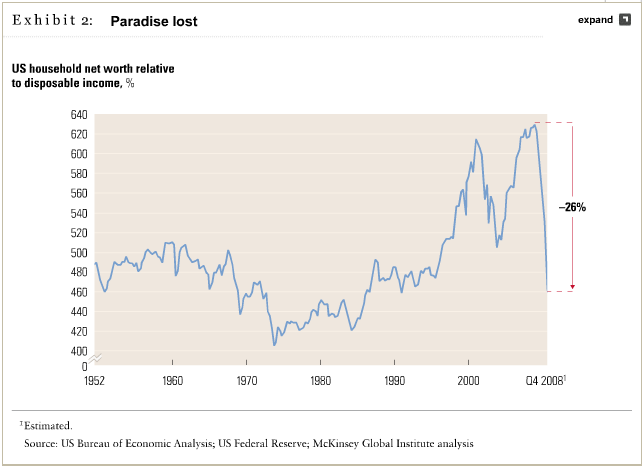
From McKensey, and interesting look at household net worth relative to disposable income.
So far the net worth has fallen a good deal more than in the 2001 bear market… the result being a decrease in consumption and an increased savings rate to make up for the losses.
Implicit in the chart is the fact that household net worths, in aggregate, fell about 160% of annualized disposable income. That means consumers would need to save every possible (discretionary) penny for the next year and a half to get back to the recent high.
The current bounce was fueled by a combination of deteriorating but ?less bad than expected? economic reports (therefore counting as ?upside surprises?), as well as what can only be considered misleading and semi-fraudulent earnings reports from distressed financial companies (the CEOs of these companies should be careful, because Bernie Ebbers is their poster child). Overall, the picture looks a lot like the bounce we observed in May 2001 (just before unemployment shot up and the market plunged again to fresh lows)…
As for the bank ?earnings? that we observed last week, it is worth repeating that operating earnings exclude what happens on the balance sheet. Moreover, we’ve seen some really fascinating accounting distortions in these numbers. Witness Goldman Sachs’ missing month of unreported losses. As the WSJ noted ? Goldman Sachs, for instance, announced earlier that it would change its fiscal year to end in December, unlike previous years when Goldman’s year-end was in November. The move effectively eliminated a very ugly month from Goldman’s official annual financial results for both 2008 and 2009.? As for Citigroup, the Journal reported Saturday that Citi’s $1.6 billion reported earnings benefited from ?a little-followed accounting adjustment under Financial Accounting Standards Board rule 159, which governs how banks value their debt? (note that this is separate from the FAS 157 ?mark-to-market? provision). The effect of the adjustment was to boost Citigroup’s earnings by $2.4 billion, because the value of its debt declined. So Citi reported earnings strictly because its bonds lost value. This would be funny if it was not so insidious.
Think about those last statements… Goldman Sachs made an entire month disappear, and Citigroup made an operating profit because it was able to lower the value of money it has borrowed from other people.
It takes a special kind of moral flexibility to run a big bank these days…