September 2006
Monthly Archive
Sun 24 Sep 2006
Posted by Jason G. under
TradingNo Comments
As I’ve noted in the past, Natural Gas has been trading very low lately for a variety of reasons. With a seasonal pattern of bottoming in September, I’m interested in looking at how to invest in the potential upside of this essential commodity.Importantly though, my view of the futures market for Natural Gas is not very accurate… Not surprising, you need to look at the other futures contracts, not just the most commonly cited front-month.
When you look at the other futures contracts, you will notice that the prices are in cantango, which is not a big surprise when you think about it. Here are the prices from Friday: (more…)
Sat 23 Sep 2006
Posted by Jason G. under
ResearchNo Comments
No, not that big “O”, but rather the company that trades under the ticker “O“, Realty Income Corp. That was the most surprisingly bland name of the one letter ticker symbols that I recently reviewed out of curiosity… (more…)
Fri 22 Sep 2006
Posted by Jason G. under
Discussion[2] Comments
So the conspiracy nut inside of me wants to talk about Amaranth, and how they are the first domino in a long line of dominos…
Maybe pension funds and other less aggressive investors will realize that they don’t really want the added risk that comes from investing in hedge funds, and start to pull their money out of hedge funds, broadly and without any distinction… With decreasing assets in hedge funds, many have to start liquidating their positions and de-leveraging… Prices start to fall since most hedge funds have a long-only bias (a side effect of the Bernanke/Greenspan Put?), and their selling causes prices to fall despite the lock-up periods they have forced their investors into… and prices begin falling across the board with stocks and commodities (remember, pricing happens at the margin)… we see liquidity disappear more convincingly than a David Copperfield magic trick… spreads widen, and a sharp downturn begins…? The markets panic, and the bottom falls out… (The sky turns to fire, the sea turn to blood…)
But then I snap myself out of it, and realize, Amaranth was a HUGE fuck-up, but they still met their margin calls. Sure, they lost $6 billion or 65% of their assets, but their brokers cut them off before they presented a risk to the entire financial system… unlike LTCM where the brokers were blindsided by how much exposure they had, and had to have the Federal Reserve twist their arms until they dealt with the situation.
The risk of failure was born by those that could bear it. The failure wasn’t paid off by the public at large in the form of higher taxes like the Savings & Loan crisis back in the early 80s… The burden wasn’t hoisted on unsuspecting employees who had all their 401(k)s invested in the company stock (Enron)…
So, have we progressed to the point where we can survive the failure of a significant player in the markets? Can we rest easy knowing that we’ve learned a lot since 1998 when LTCM imploded?
Or maybe, just maybe, those who are currently bearing the risk will realize that it might be more risk than they originally anticipated… and then they start to pull their money out of hedge funds…
Thu 21 Sep 2006
Posted by Quicksilver under
Off TopicNo Comments
It’s actually not uncommon for Nijonjin to breakout spontaneously and wordlessly into Rock/Paper/Scissors when reaching for the same cab door or the last piece of ebi-zushi.? Who knew that it went all the way to the top?? Do companies need to disclose this kind of decisionmaking to the shareholders?? Is that really what all those traders on the floor of the CBOT are doing with their hands?
Thu 21 Sep 2006
Posted by Jason G. under
ResearchNo Comments
I came across some interesting observations while doing some research on the historical prices of the AMEX GoldBugs Index (symbol HUI). The HUI is made up of the 15 largest unhedged gold producers in the world, and is one of my primary ways to track gold stocks in the aggregate.
As gold has wobbled and fallen quite rapidly lately, the HUI is moving quite a bit too. Over the last few trading days, it has seen quite a bit of volatility including several single day moves of more than 3% (up or down) and a single day of -7.6% (9/11/06)!
How common is this? looking at the 10 years of data since the index was created, there have actually been 49 days where the index moved up or down more than 7%. (For the gold bugs out there, there were 37 up days and 12 down days.)
Out of the 2500 trading days, a full 10% of the trading days exceeded a 4% move! (A full 60% of those days were UP days.)
Most amazing, there were 2 days where the index spiked defied all adjectives by moving higher by more than 15% including the largest single day gain of 24% back in September of 1999 when God himself smiled on the gold bugs and 15 central banks suspended their gold sales all at the same time…
The largest single down day for the index was -12.6% in July of 2002 when something happened that was important to gold, but not important enough for Google to find it some 4 years after the fact…
And almost by definition, indexes are typically much less volatile than individual stocks, so imagine how much individual gold stocks are moving!
Wed 20 Sep 2006
Posted by Jason G. under
Commentary[4] Comments
Here’s another hedge fund manager who likes to play it loose in the energy markets… but this fund’s losses are much bigger than the MotherRock implosion back in August.
Amaranth Advisors, a hedge fund with $7.5bn under management, has warned investors that its main funds are down 35 per cent or more this year after big losing bets on natural gas prices.
“We are in discussions with our prime brokers and?.?.?.?are working to protect our investors while meeting the obligations of our creditors,” Nicholas Maounis, Amaranth’s founder, said in a letter to investors.
And their selling may also be the cause of much of the downward pressure in the Natural Gas market (some speculate the situation is affecting the gold markets too): (more…)
Wed 20 Sep 2006
Posted by Jason G. under
Commentary1 Comment
In case you guys hadn’t read the news, my old friends at ICE (Intercontinental Exchange) are buying the NYBOT (New York Board of Trade). The price of ICE was up 15% in Friday’s trading when the news was announced…
I remember back in the day, a question came up of why does ICE even exist? There are quite a few different answers… all with varying roots in reality. (more…)
Tue 19 Sep 2006
By popular demand, I’d like to post an update of the real-money Uberman’s Portfolio to date.? As you may recall, armed with the?power of Grayskull?and some ring with crazy writing on it that I got from a giant eyeball on a mountaintop (something about “forged from the fires of Doom blah blah blah”), I took the plunge with my own cash at the start of August.? Since then, I’ve risen at 8am each Monday to perform my dark magic (hit F9 in Excel) and slay the dragons of the market (spend 5 minutes typing in some orders then crawl into the shower).? I spend the rest of the week slavishly watching my assets fluctuate wildly (watching girl’s assets fluctuate wildly), hoping against hope that I’ll come out ahead in the end (umm…).? Then, the ugly cycle repeats… (more…)
Mon 18 Sep 2006
Posted by Quicksilver under
Commentary ,
MacroNo Comments
I love coming across interesting charts that just make you go, “Hmm…”, like the one I posted about median income.? Here is another “Hmm…” chart that seemed to fit the vibe of recent posts:
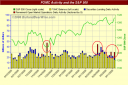 (more…)
Mon 18 Sep 2006
Posted by Quicksilver under Uncategorized
No Comments
I add a link to the blogroll for Bill Cara’s site.? I think you will find it an interesting addition to the “static”.? He has a uniquely insider view of things and often links you to the reports coming out of big financial institutions (the big money) that only clients normally see.? He also does an extensive weekly review of sectors and interesting stocks.
« Previous Page — Next Page »
