This is a little old (June 2, 2008), but worth sharing…? John Hussman reviewed the FDIC Quarterly Banking profile…? here’s what he found.

?Industry earnings for the fourth quarter of 2007 were previously reported as $5.8 billion, but sizable restatements by a few institutions caused fourth quarter net income to decline to $646 million.?

Note what the FDIC is saying here. The banking industry reported $5.8 billion in earnings to its investors, but restatements took that total down by 89%. Stop and think about that – only 11% of the earnings that were reported to investors survived after the restatements. And yet, investors seem naively willing to take recent earnings reports, guidance and charge-off levels at face value, as if these reports can be trusted. Unfortunately, all that seems to matter to investors over the short-run is whether earnings-per-share can beat estimates by a penny, regardless of whether they are massively restated later.

Quite an indictment…? and the whole article is worth reading if you want to understand the state of banks today, and why they’re still not as cheap as one might think.

The FDIC shut down IndyMac over the weekend, and I read the following quote in the International Herald Tribune:

The bank is scheduled to reopen Monday as IndyMac Federal Bank, FSB, under the oversight of the?FDIC.

The FDIC estimates its takeover of IndyMac will cost between $4 billion and $8?billion.

I was wondering, where does that $4 to $8 billion come from?? Here’s an explanation from the internets:

Where does the FDIC get its money?
From assessments on insured banks, and interest on U.S. Government securities it holds.

How much do the insured banks pay the FDIC?
Insured banks pay annually a gross assessment of one-twelfth of 1 percent of their total deposits.

What direct commitment does the Treasury have to the FDIC?
The 1947 amendments to the Federal Deposit Insurance Corporation Act provide that the FDIC can borrow up to $3 billion from the U.S. Treasury at its discretion. The law directs the Secretary of the Treasury to put up this $3 billion any time the FDIC wants it.

NOTE: The website/book is from 1962, so the details may have changed since then (it references a $10,000 insured amount, which has obviously changed).

IndyMac had about $20 billion in deposits earlier in the year…? which means their annual assessment would have been around $17 million dollars…

Just like the PBGC, it may be self funded, but as soon as demand for coverage overwhelms that self-funding, it is ultimately the tax payers that are on the hook.

Marketwatch is leading with a headline this eveing saying “WaMu bucks bank trend“.? And indeed, the stock is up over 8% in after-hours trading…? but that’s hardly the whole story, despite a sensational headline…? Which one of the following details do you think is the most important for WaMu today?? The one where it “leaped” by 9% after hours, or the one where it went down over 34% earlier in the day?

Feel like you need some serious charting?? Blocks is a rather good technical analysis software tool for charting stocks and the like (sorry, no commodities or currencies, from what I can tell).? It’s got some serious features for power users, and happens to be developed locally in Durham (the parent company is based in Florida).

The great thing is, if this is a tool that interests you, is that the base package for charting is free.? Costs for real time data, fundamental data, etc. are comparable to other products, but you should be able to try out the platform before plunking down any serious coin.

FYI, Windows only.

In case you’re interested…? Wisdom Tree has released a couple of new ETFs to track more currencies.

  • CYB – Chinese Renmibi
  • ICN – Indian Rupee
  • BZF – Brazilian Real
  • JYF – Japanese Yen
  • EU – Euro

Trading the Euro and Yen via ETFs are old hat (see FXE and FXY), but the others are useful, at least for those of us who don’t go directly to the foregin exchange markets…

I just realized there is a easily accessible version of the TED Spread available online… from Bloomberg: the TED Spread.

Wikipedia explains the logic of the TED Spread:

…the TED spread is now calculated as the difference between the three month T-bill interest rate and three month LIBOR. The TED spread is a measure of liquidity and shows the degree to which banks are willing to lend money to one another.

There is a good reason that the LIBOR rate is getting pushed higher than the T-bill rate…? US Banks can go borrow in Europe without disclosing it — something they weren’t able to do in the US until the recent TAF and similar Fed sponsored bail outs programs were made available.

It’s noteworthy that the TED has started trending upward again over the last month or so.? This is an indication that more banking turmoil lies ahead…? although with IndyMac going down, Freddie and Fannie in the headlines, I’m surprised that this hasn’t spiked even higher.

From John Hussman, when talking about recent prices in the Crude Oil market:

Geek’s Rule o’ Thumb: When you have to fit a sixth-order polynomial to capture price history because exponential growth is too conservative, you’re probably close to a peak.

You’re usually in unusual territory when exponential growth is too conservative.

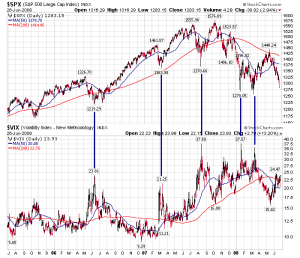
If you’re wondering where the next rally will begin (whether you beleive it will be a bear market rally or the next bull market), it is a good idea to watch the VIX index.? As you can see from the chart below, medium-term lows for the SPX (S&P 500 Index) coincide with upward spikes in the VIX.? At current levels, we don’t have a spike, though this isn’t a precise indicator of timing.

SPX and VIX

You can track the VIX at the usual places.

It’s worth a quick note that a few great actively managed mutual funds have re-opened for new investors:

  • DODGX – Dodge & Cox Stock Fund – large cap value
  • LLPFX – Long Leaf Partners – large cap blend of growth and value
  • SEQUX – Sequoia – large cap growth
  • TASCX – small cap blend of growth and value

These mutual funds closed to new investors at various points in the past because their fund managers did not feel that the existing fund holders would benefit from new investors rushing in when performance was hot.? It’s not too common that a fund manager sides with their existing fund holders rather than growing their assets under management (more assets = more fees), so it’s worth noting when a manager does the right thing.

They’re all off their highs from last year, but for long term holdings, these mutual funds are a good bet.

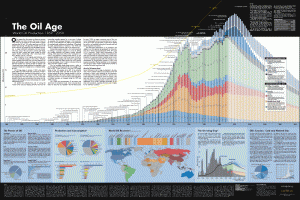
Peak OilI found this ginormous poster depicting Peak Oil over at an educational website appropriately named, PeakOil.org.

You can order your own physical copy for $12.50, or enjoy it online while spreading the message.

From the website: “The poster’s main chart features a year-by-year rendering of worldwide oil production from 1859 to 2050 with projections of future production based on Colin Campbell’s Oil Depletion Model.”

Warning, the picture is 1567px ? 1045px, which means you need a big monitor to see it all…

« Previous PageNext Page »