Wed 27 Feb 2008
It’s not just sub-prime folks… Michael Jackson’s Neverland Ranch may go up for auction under foreclosure soon, and Veronica Hearst (of the Hearst publishing empire) recently lost a beach-front mansion to foreclosure…
Wed 27 Feb 2008
It’s not just sub-prime folks… Michael Jackson’s Neverland Ranch may go up for auction under foreclosure soon, and Veronica Hearst (of the Hearst publishing empire) recently lost a beach-front mansion to foreclosure…
Mon 25 Feb 2008
At the end of last year I found myself banking at a new bank… the interesting thing to consider is that I copied down the interest rates for my savings account at this bank at the time, which provides for a nice point of comparison.
Here is a quick table of the interest rates back then compared to today. Mind you, this is only after 3 months time…
| Balance | Dec 2007 | Feb 2008 |
| Up to $1k | 2.05% | 1.26% |
| Up to $5k | 3.11% | 1.31% |
| Up to $10k | 3.49% | 1.76% |
| Up to $25k | 3.63% | 1.86% |
| Over $25k | 4.26% | 2.01% |
I can only imagine how low rates are at the big retail banks.
The interest rates to be earned on cash have been cut in half in barely a quarter’s time. I read in a news article today that the same bank has put thousands of HELOCs on hold (HELOC = home equity line of credit) due to fear of falling real estate values that back the credit.
The flip side is that you can still get higher rates from the online money market accounts… ING Direct (3.4%), HSBC Direct (3.55%). They’re down significantly from previous rates (~5% for HSBC), but not quite as dramatically as retail banks.
And if you’re not too particular (or have complete faith in the FDIC insurance) you can also go to E*Trade for 4.1% rates.
Sun 17 Feb 2008
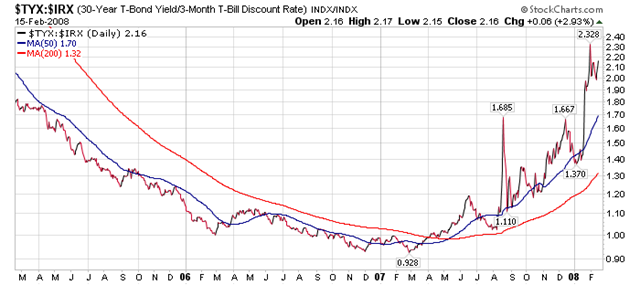
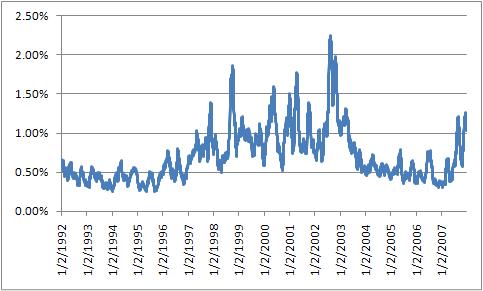
It’s worth taking note that the recession calculator is forecasting with a 94% probability* a recession will occur in the next 12 months. The calculation is based on the current 10 year, 3 month, and overnight rates…
It’s not surprising, considering that the yield spread (30yr/3mo) looks like this:
Thu 10 Jan 2008
I recently managed to run into a real black swan in on vacation in Hawaii of all places…

Tue 8 Jan 2008
John mentioned a little while ago an opinion that Growth was set to outperform for a while… I took it upon myself to follow up on this fact, and the results are quite impressive.
Comparing the Growth stocks in the S&P 500 against the Value stocks (as defined by the IVW = Growth and IVE = Value SPDR ETFs), Growth is in fact putting in an impressive performance (this is a 3 year view):
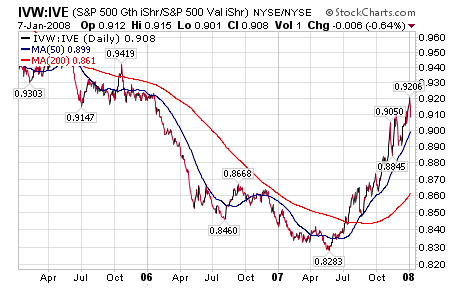
As the growth etf performs better than the value etf, the line rises. Since May of 2007, growth has been on a tear. As a form of kudos, John’s note about Growth outperforming was posted on May 14… right at the nadir on the above graph.
Likewise, Growth is outperforming the entire S&P 500:
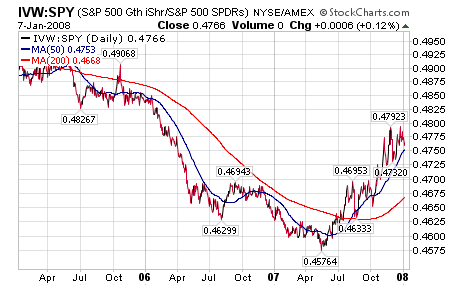
While we’ve seen a few high-flying growth stocks take a beating recently during market dips (see GOOG, AAPL, etc.), these stocks as a group are actually doing quite well. During market declines, the outperformance would take the form of falling less in aggregate.
Sat 5 Jan 2008
I ran into this interesting post over at the Bespoke website…
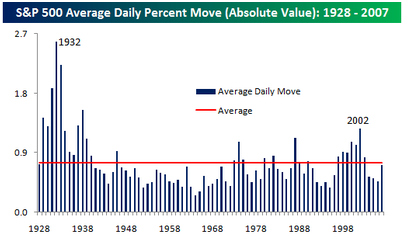
While most would agree that the stock market has certainly been more volatile this year, putting it in perspective with the long term trend shows that by at least one measure, the S&P 500 was less volatile this year than its long term average.
The chart below summarizes the average absolute daily price change in the S&P 500 by year. In 2007, the average worked out to 72 basis points, which means that, on average, the S&P 500 had a daily move (up or down) of 0.72% versus an average of 0.75% since 1928. While this year was more volatile than the last three years, prior to those years, the last time the market was this ‘placid’ was in 1996.
While this is a very good point and good analysis, I decided to do a little of my own analysis and found… I don’t have as much data as Bespoke does. Going back to 1950 (the furthest back I can go with free and easily available data from Yahoo Finance), the average daily change is 0.62%. That makes sense, considering that I couldn’t include the 1930s when volatility was so high.
Despite that, I forged on to find a few interesting things… if I look at the 30 day moving average of daily price change, we get a slightly different picture. The average volatility for 2007 has been skewed lower from the low-volatility of the first 6 months of the year. Outside of the last three years, the last time volatility was this high/low was early 2002 when the markets were mid-patriot rally.
Similarly, it is worth looking at volatility on multi-day time frames, such as weekly price change or monthly price change. As we go to longer time frames, the changes look more similar to the first chart that Bespoke published.
Wed 2 Jan 2008
It is amusing to hear all the gold bulls, and more recently the mainstream media, proclaim that the Fed is “pumping liquidity” into the system. The logical conclusion is that either the Fed is going to ruin the dollar or save the stock markets, depending on who is talking.
But John Hussman has a different take on it… all the “pumping” is simply the roll-over of short term paper lent to banks. Here is a quote from his December 17 commentary:
Last week, the Fed executed the first of its highly publicized ?term auction? transactions. As I noted in A Little Acid Test for Fed ?Liquidity? last week, the Fed had $53 billion in repos outstanding on Friday December 14, fully $39 billion of which were due to expire last week. This ensured that the Fed would initiate new repos of a similar amount. The acid test was whether the term auction repos would represent a) new liquidity, or b) just a different way of rolling over the same money. Last week, we learned the answer to that question is b.
This will be something to watch, as Hussman points out in Monday’s notes:
…on Friday January 4, the huge 16-day 350 billion EUR refinancing from December 19 expires. This ensures that the media will (misleadingly) report a huge apparent injection of liquidity by the ECB on Friday. The question is how huge.
…As for the Fed, a few of the short-term repos the Fed provided for holiday liquidity will expire on Thursday [Jan 3]. Until then, the extra $10 billion or so of repos in the system may put a bit of pressure on the Fed Funds rate, holding it below the target of 4.25% for a few days. The most likely day for any apparent “liquidity injection” will be that same day (Jan 3) due to the expiring repos…
Fascinating stuff, and quite interesting to peel back beneath the headlines about liquidity injection. Hussman recommends going directly to the Fed or ECB’s websites to see the data yourself; see his full articles for links and more detail on the topic.
Mon 31 Dec 2007
Back in my Econ classes, the professors laid out their version of the “proper” way to manage the Fed and the economy. Core to it was the concept of having orderly declines, rather than sharp, abrupt shocks to the system. In the 70s we had oil shocks, in 87 a single-day crash in the markets… If only (the academic argument proposed) the changes could be managed to be orderly, we would be better off as an economy.
As we can see with the current environment, this academic concept seems to have graduated to the policy makers… whether it is an orderly decline in the dollar, or stalling tactics by the Fed to let the financial stocks have an orderly decline (super-SIV anyone?), or spinning the stock markets with well-timed announcements… the Fed and the Treasury are aiming at maintaining order despite problematic situations.
The side-effect of this managed order is a lot of volatility on a short trip. The S&P 500 looks like it will finish the year with a 3.6% gain, despite having a range of over 15% throughout the year (as measured by the distance from 52 week high to 52 week low).
So, is the economy in for a recession, and by implication, is the market preparing for a bear market? I’m not sure… though the arguments are strong in either direction. I think the following quote sums up the bullish posture for me.
Week after week we?ve heard reports about the dangers to housing along with the specter of hundreds of thousands of home defaults. On top of that, we?ve read about the massive losses to the leading banks brought on by the subprime mess. We?ve been warned of a potential collapse in the entire domestic and international banking system. We?ve heard that lending by the big banks had come to a virtual halt.
In the face of all this ghastly news, the November lows in the D-J Averages have held like a rock. Increasingly, it appears, the Averages have discounted the worst that can be seen ahead. As I write, both Averages are well above their November lows.
Naturally, stock market stability despite economic turmoil is not the final arbiter in our analysis of where the markets will head from here. Market efficiency is a process after all, and the markets may still be coming to grips with economic reality.
That said, I will be watching to see which way the prices break after volume returns in the new year.
Tue 18 Dec 2007
It’s the time of year again for mutual funds to be disbursing their taxable income in the form of dividends… as we saw last year, some of the really good actively managed mutual funds have very large disbursements to make. The upside is that if you own these funds in a taxable account, they just gave you the funds needed to make your tax payments to the IRS.
If you were invested in the mutual fund for the whole year, you should have done well… but often these disbursements settle the taxable income from multi-year holdings, resulting in a tax hit for those who may have bought this year, but get to enjoy all the taxable events regardless of whether they owned when the mutual fund purchased the assets.
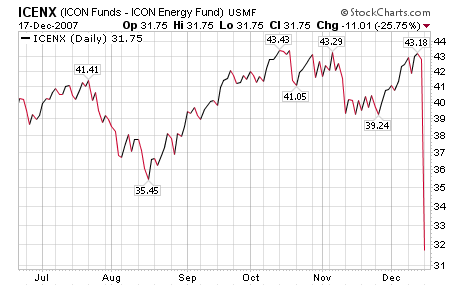
Here’s a shockingly too common chart ? ICENX is down 25% on its disbursement date (most likely 2% or so of the change is from daily changes in its holdings).
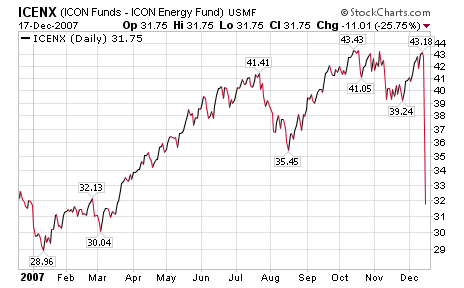
That means, if you bought in the last 6 months, you just inherited a tax burden that you didn’t “earn”.
While it’s great that the fund was able to earn 25%+ gains this year, this is an all-too-real problem for mutual fund investors. This is also one of the reasons why ETFs have gained so much in popularity… as the buyer and seller of an ETF, you get the benefit of determining when (and if) you incur a taxable event.
Sat 15 Dec 2007
From Extremely personal investment:
If you want to know how the economy is really doing — check the boob job index.
Plastic surgeons report people are getting antsy about spending big bucks for bigger breasts or a nose job.
The Wall Street Journal reported that the slowdown was a hot topic at a recent meeting of the American Society of Plastic Surgeons in Baltimore.
Pittsburgh plastic surgeon Dr. J. Peter Rubin said the mortgage credit crisis is making people think twice.