Research


Quite a while ago, we discussed drawdown analysis for mutual funds, and how understanding drawdowns can help in setting properly positioned stop losses… With two of my mutual funds dropping down against their stop loss levels, it’s time to revisit the analysis.

We’re looking at OAKMX and OAKIX, both long term value oriented mutual funds run by Oakmark Funds. OAKMX focuses on large cap value; OAKIX focuses on large cap international value. Here are the 3 year performance charts of the two mutual funds:

OAKMX 3 year chart OAKIX 3 year chart

Wow, good runs on both funds. (more…)

There’s an excellent article titled “How professionals dump their toxic waste on you” by Paul Tustain that is worth reading. He starts with much of the current situation in subprime loans that we’ve talked about before… but then goes on to some additional interesting topics… below are some highlights.

Many investment funds (pension funds, bond funds, etc.) are holding CDS (credit default swap) portfolios as income generating bond-equivalent securities. The catch is that many of the CDSs are not actually insuring against default, but the other side of a speculative position that a risky borrower would default. The example cited was Delphi Corp’s recent fall from grace — when their debt was defaulted on, an astounding 10 times the amount of the debt was executed in the form of CDSs on their debt.

So these pension funds, hungry for bond-like returns, basically took the other side of a bet that Delphi would collapse. Not exactly investment grade, but thanks to financial alchemy, a pool of these CDSs were highly rated, and most likely offered to the buyers with leverage. (more…)

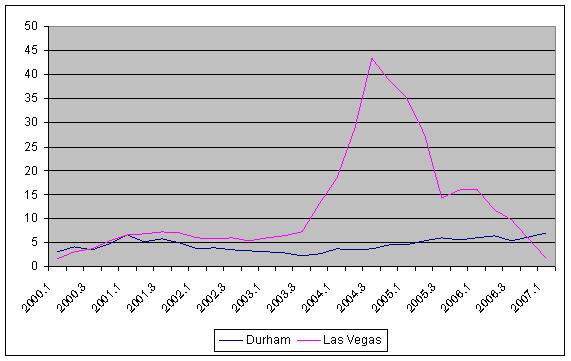
A few days ago I was asked how real estate was doing in Las Vegas…

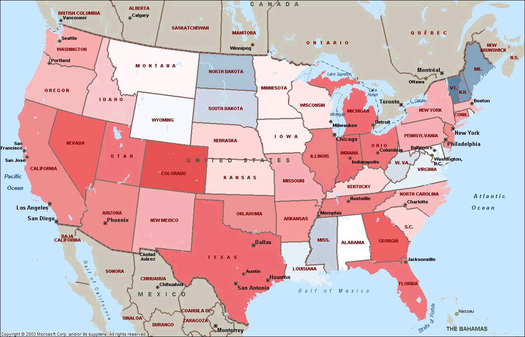
Here’s the a chart from the government’s official house price appreciation (compared to Durham for kicks and giggles):

Las Vegas Home Price Appreciation

Within the metropolitan area of Las Vegas, there are approximately:

  • 7,132 pre-foreclosure properties
  • 2,457 properties up for auction
  • 5,365 bank owned properties (e.g., the foreclosure occurred and now the bank owns the house/property)

Here are the same numbers for Raleigh. For comparison, Raleigh is about half the size of Las Vegas:

  • 557 pre-foreclosure (15% as much as Las Vegas, adjusted for population)
  • 7 auction (0.5%, adjusted for population)
  • 562 bank owned (20%, adjusted for population)

And to add insult to injury, the average price of pre-foreclosure houses listed on RealtyTrac (where I looked this up) was approximately 2x or more in Las Vegas, despite only have a 20% higher cost of living…

There’s also an interesting ecological / health issue with pools attached to abandoned or underfunded properties… the stagnant standing water (if not property treated with chemicals) are a hotbed for mosquitoes and mosquito related program activities.

The Southern Nevada Health District, which includes pool-packed Las Vegas, relies on neighbors’ complaints to identify pools green with algae. By June 25, the district’s “green pool” count outpaced last year’s numbers by more than a fourth. Many involved vacant homes in the process of foreclosure, environmental health supervisor Mark Bergtholdt says.

(The pool/mosquito problem is also present in Southern California and Arizona where pools are common and foreclosures are unfortunately increasing.)

Yet another CPI report was released on Friday, and quite a few people are reading the same report with different conclusions…

CPI “proper” indicated a 2.7% rate of price increases… While the Core CPI rate indicated a 0.1% rate of price increases. Those that look at CPI think that inflation is ramping up, and those that look at the core rate think that inflation is under control.

Sidebar: one important point is that prices do not inflation make — inflation is a monetary phenomenon (a change in the money supply), and price changes are a visible side-effect (with a lag) of the monetary inflation. We’re playing a guessing game looking at prices and thinking that prices “are” inflation.

The inflationist camp will argue that the 0.1% core rate was rounded down from 0.149%, which is a true and convenient talking point, but they’re missing a much bigger problem.

What is the Core CPI? According to Briefing.com:

CPI can be greatly influenced in any given month by a movement in volatile food and energy prices. Therefore, it is important to look at CPI excluding food and energy, commonly called the “core rate” of inflation.

(more…)

The NY Times has a new Freakonomics article about cash-back financing from real estate transactions. The gist is that, even though illegal, real estate buyers have been frequently using cash-back financing to come up with the down payment for their new homes.

So, not only are the weak hands in the real estate market going with adjustable rate loans during a period of historically low interest rates, but they’re also levering up additionally just to get the down payment…

Here’s a good chart (from Mish) that shows how many of those adjustable rate loans are about to reset…

Mortgage Rate Resets

Even though some areas continue to be stable, I think we can expect continued weakness in those areas that used to be ultra-hot…

A quick check of the mortgage-lender implode-o-meter shows over 80 mortgage companies have run into trouble…

They say that real estate is a local market, and the moderate strength in the Durham MSA as per the latest (1Q 2007) numbers from the OFHEO certainly proves the point.

Durham’s growth rate is up 7.07% in Q1 (the rate is annualized), which is pretty good.

Take a look at Durham vs. Raleigh: (more…)

It’s amazing to see the Dow above 13,000… an all-time high. But it’s interesting to realize what that means… what is really at an all-time high? The Dow is a price weighted index (read how splits and dividends are included if you really want to know), which means that not every component contributes the same amount to its ups and downs…

Different weighting is actually normal, but the Dow has an unusual weighting — it’s components are weighted based on price. That means that stocks with higher prices have a higher impact on the index (with some caveats — nothing is simple). In contrast, the S&P 500 is market-cap weighted, which can cause it’s own caveats and unusual behaviors…

A side effect of the price weighting is that (relatively) smaller companies like Boeing, 3M, and Caterpillar have a larger impact than larger companies like GE, Microsoft, and Pfizer. (more…)

I found a good little blurb (and a good chart) on Ticker Sense regarding the S&P 500’s 5% decline and previous such declines…

With today’s near 1% decline, the S&P 500 is now down 5.86% form its peak on 2/20. This is the seventh time during this bull market that the S&P 500 has declined by 5% or more from a peak. In [the chart], we plot the S&P 500 highlighting each correction in red. The lower chart shows the percentage decline in each correction on a cumulative basis (from peak to trough).

On average, declines have lasted an average of 74 calendar days. Once the market does reach its low point, it has taken an average of 64 calendar days to recoup the losses.

While looking at historical patterns can mislead as easily as it can enlighten, it is worth noting that we’re not talking about a short-term one-week dip and one week recovery here.? With an average decline timeframe of 74 calendar days, we aren’t going to see the markets make new highs tomorrow if/when a recovery starts. (more…)

Another pretty picture from RealtyTrac via The Big Picture… this one shows the real estate/housing foreclosures by state… the redder the states, the more foreclosures per capita.


Foreclosures by State

While the residential real estate market continues to soften, REITs are still going ganbusters (thanks to the EOP buyout), and homebuilders are doing quite well too.

From FT Alphaville:

Red Kite Management, a $1bn metals-trading hedge fund, has suffered losses of up to 15 per cent so far this year… The news sparked heavy falls on the metals markets…

The report had a marked impact in the metals markets on Friday afternoon. In trading on the London Metal Exchange the price of copper fell 6 per cent, while aluminium was down 3 per cent and zinc slumped more than 8 per cent. ?Fund liquidation?a lot of stops triggered?a lot of the stuff on the back of the Red Kite news,? another trader told Reuters.

While a 15 to 20% loss doesn’t seem so bad, the fact that it has occurred in the last 5 weeks may be a harbinger of more trouble… (more…)

« Previous PageNext Page »

Subscribe to Tasgall

Categories

Archives