From last week’s Hussman weekly commentary

Last week, the Mortgage Bankers Association released the most comprehensive report available on third quarter delinquencies. Here is a summary of points from that report:

?The delinquency rate for mortgage loans on one-to-four residential properties rose to a seasonally adjusted rate of 9.64% percent of all loans outstanding as of the end of the third quarter of 2009. The delinquency rate breaks the record set last quarter. The records are based on MBA data dating back to 1972. The combined percentage of loans in foreclosure or at least one payment past due was 14.41% on a non-seasonally adjusted basis, the highest ever recorded in the MBA delinquency survey.

?Job losses continue to increase and drive up delinquencies and foreclosures because mortgages are paid with paychecks, not percentage point increases in GDP. Over the last year, we have seen the ranks of the unemployed increase by about 5.5 million people, increasing the number of seriously delinquent loans by almost 2 million loans and increasing the rate of new foreclosures (on a quarterly basis) from 1.07 percent to 1.42 percent,? said Jay Brinkmann, MBA’s Chief Economist.

?Prime fixed-rate loans continue to represent the largest share of foreclosures started and the biggest driver of the increase in foreclosures. The foreclosure numbers for prime fixed-rate loans will get worse because those loans represented 54 percent of the quarterly increase in loans 90 days or more past due but not yet in foreclosure. The performance of prime adjustable rate loans, which include pay-option ARMs in the MBA survey, continue to deteriorate with the foreclosure rate on those loans for the first time exceeding the rate for subprime fixed-rate loans.

?The outlook is that delinquency rates and foreclosure rate will continue to worsen before they improve. The seriously delinquent rate, the non-seasonally adjusted percentage of loans that are 90 days or more delinquent, or in the process of foreclosure, was up from both last quarter and from last year. Compared with last quarter, the rate increased 82 basis points for prime loans (from 5.44 percent to 6.26 percent), and 216 basis points for subprime loans (from 26.52 percent to 28.68 percent).?

Yikes.

Here’s a nice chart from Clusterstock

200911291203.jpg

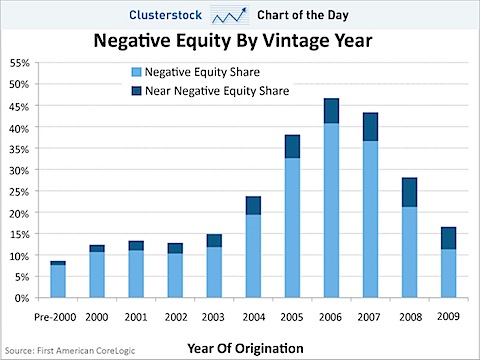
How to read this? For the year 2005, the year I bought my house, over 30% of the mortgages have negative equity.

I’ve probably heard a hundred times that the stock market is a leading indicator for the economy.

Well, it is a leading indicator, except when it isn’t. Bob Hoye sheds some light on the topic:

For those whose dwell in GPD-Land, [the 2007 peak] is very important. At normal peaks, the cycle for stock certificates leads the peak in business activity by some 12 months. For example, the Dot-Com peak was in March 2000 and the NBER determined that it officially started in March of 2001.

The only times the peaks have been coincidental has been at the climax of a great financial mania.

For those who appreciate official numbers, in 1873 the crash began in mid September and the NBER determined that the recession started that October. In 1929, as everyone knows, the crash began in mid-September and the NBER date was set as that fateful August.

He goes on to point out a few interesting points…

  • In 1930 when the Secretary of Labor was on the “upswing”, unemployment was around 9 percent, as it is lately.
  • Unemployment in the 30s did not reach 25% until 1933 — a full 4 years after the stock market peak

The graphic design team at the NY Times has done it again… this time with slicing and dicing the unemployment info.

I was pretty surprised when I punched in my demographic group and found that the average unemployment is only 3.9%… Plug in different demographic groups to see what different groups have been experiencing in the job markets.

Screen shot 2009-11-09 at 1.52.08 PM.png

The Economic Policy Institute just launched their Economy Track website… and it looks pretty. They have nice charts that show how screwed we are the economy is going.

Screen shot 2009-11-09 at 10.39.09 AM.png

One amusing chart… the Job Openings and Labor Turnover chart — it looks like the ratio has literally gone off the charts.

Screen shot 2009-11-09 at 10.38.55 AM.png

Anyone have any thoughts on doing a Roth conversion given the rule changes that begin at the beginning of next year?

Most of the arguments for and against are standard fare (see this article for example), and it obviously depends on your personal financial situation… but are there any interesting or novel angles that have flavored your opinion on the matter?

The more novel things that I can think of…

  • Doing a conversion now, you fund current government spending. As they say, don’t encourage the politicians if you can help it…
  • It is generally better to avoid or postpone taxes as long as possible…
  • It is always possible that the government will change the rules later on. I only foresee this happening if the world (as we know it) is about to end, but something that should at least be acknowledged…

Those who argue that we will definitely see higher taxes in the future would be wise to think about that third point… if higher taxes are such a certainty, maybe you should also factor in a higher probability of the rules changing…

And something to think about from an investor and trader’s perspective… if conversions are popular enough it will definitely skew the gov’t tax revenues and allow for more manipulation of the information and reporting on the federal deficit. In the 90s the Clinton administration was able to claim a budget surplus thanks to the re-characterization rules being introduced… how will the politicians misuse the opportunity this time? It will certainly be fodder for the political pundits, as well as the blindly bullish market commentators.

Schwab just released a bunch of ETFs and they’re competitive on fees… and if you have a Schwab account, you can trade them with zero commissions.

Click on the picture for more detail on specific ticker sectors, fees, and comparable ETFs.

Screen shot 2009-11-03 at 11.26.00 AM.png

More info here.

Yay competition!

Food for thought…

TheSecondWave.1.gif

Here’s 10 Principles of Economics, translated by The Stand Up Economist:

From Barry Ritholtz, a very important distinction on what is toxic

I keep hearing people discuss Toxic Assets.

This is actually a misnomer of sorts; its not the Assets that are fatal, toxic, deadly, etc ? its actually the Pricesthat are TOXIC.

Assets that are substantially mispriced are damaging to their holders? balance sheets. Its much more accurate to think about these not as assets that are toxic ? but as pricing that is toxic.

EXAMPLE 1: Bank A has $ 22 billion of mortgages on their books at 100 cents on the dollar,
? but we have since learned that: a) 7% percent are 30 days late; b) 12% are delinquent (60 days past due); c) 6% of these mortgages have defaulted and are in foreclosure;

These assets are certainly not worth nothing ? but neither are they worth 100 cents on the dollar. They are considered toxic because there is a huge billion dollar write-down coming.

EXAMPLE 2: Bank A sells these assets to Private Equity firm Z for 46 cents on the dollar.
After the defaults and foreclosure writedowns, Bank Z calculates it is worth 67 cents on the dollar.

Not Toxic!

Same assets, different pricing, different outcome.

The toxicity is a function of pricing ? not the assets themselves.

Here’s a fascinating interview on CNBC with Jim Rickards where he discusses what the Fed is trying to do with a gradual decline in the US Dollar.

Via Zero Hedge.

« Previous PageNext Page »