Sat 26 Sep 2009
Just a quick note, you can now subscribe to this blog by email. You can either enter your email address below, or follow the links in the right column of the page at any time.
Sat 26 Sep 2009
Just a quick note, you can now subscribe to this blog by email. You can either enter your email address below, or follow the links in the right column of the page at any time.
Mon 21 Sep 2009
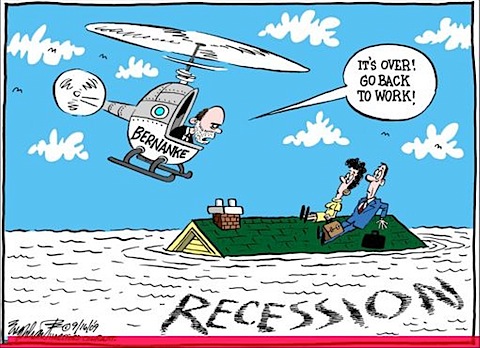
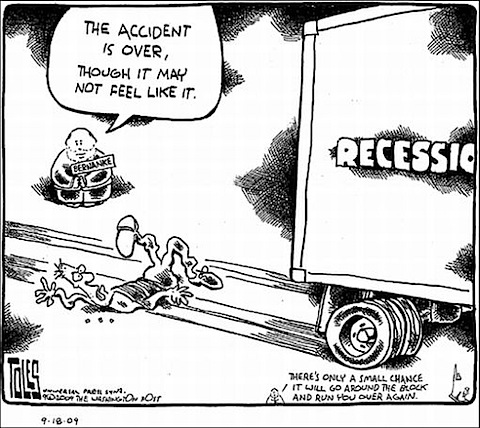
Some editorial cartoons that are making the rounds…
Mon 14 Sep 2009
Here’s a quick blurb from the latest Hussman Weekly Commentary…
With mortgage delinquencies and foreclosures still pushing new records, and little reason from employment data (and particularly temporary hiring) to suggest a turnaround in job creation, it appears very likely that we will observe further deterioration in the balance sheets of major financials over the coming quarters. My impression is that significant balance sheet losses are already mounting unreported (but don’t show up in gleeful ?operating profits? because of weakened mark-to-market rules earlier this year). Eventually, push will come to shove, but it’s not clear when, so it’s not particularly useful to sit at the edge of one’s seat waiting for the other shoe to drop. It might very well take until next year. In any event, the likelihood is strong in my view that the credit crisis is not over. I believe it is a large mistake to treat current economic conditions as if we are in a typical post-war economic recovery.
Two very important points… we’re not out of the woods yet, and it may take a loooong time for the next shoe to drop.
Wed 26 Aug 2009
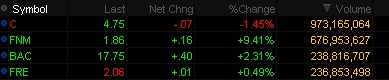
Found something fascinating at Karl Denninger’s Market Ticker website:
That’s a clever little search in which I asked for the highest-volume stocks with prices over ten cents (to exclude the little penny pumper stocks on the OTC market.)
Well gee, let’s add this up!
That would be about 2.126 billion shares in total for these four stocks, two of which (Fannie and Freddie) are so far underwater in their equity value (to the government no less!) that there is no chance they’re worth anything, yet they remain listed, and the other two are zombie banks with Citibank existing only because of… [snip]
These four stocks represented thirty seven percent of all shares traded today.
Today 3,162 different stocks traded on the NYSE. These four represent 0.13% of the total, yet they comprised 37% of the volume. That’s an over-representation of nearly 300 times the average.
This follows well with the idea that we’re not getting any real, meaningful information out of the price action in the markets due to the low volume since May.
Thu 20 Aug 2009
This should put things in perspective…
To try to exorcise the Great De- pression, President Herbert Hoover deployed fiscal and monetary stimulus equivalent to 8.3% of gross domestic product (i.e., GDP for 1933, the year the Depression officially ended). To banish the demons of 2008-9, successive administrations have spent, or encouraged to be printed, the equiva- lent to 28.9% of GDP. A macroeconomist from Mars, judging by these data alone, would never guess how much more severe was that depression than this recession. The decline in real GDP from August 1929 to March 1933 amounted to 27%; that from December 2007 to date, just 1.8% (?just 1.8%? is the phrase to use if one is still employed). So for a slump 1/15th as severe as the Depression, our 21st century economy doctors have admin- istered a course of treatment more than three times as costly.
From Grant’s Interest Rate Observer.
Mon 17 Aug 2009
Oops, the game isn’t “where’s waldo”, but rather “where’s volume?”
While commentators are clamoring that either the green shoots are taking root, or the world is about to end again… based on the relatively low trading volumes, nothing in the current market should be trusted as a means of price discovery or a measure of long-term trend.
Take the Dow 30 as an example… the last 6 trading days have had less than 1 billion shares trade. Back in March and April, it was typically between 2b and 3b shares trading.
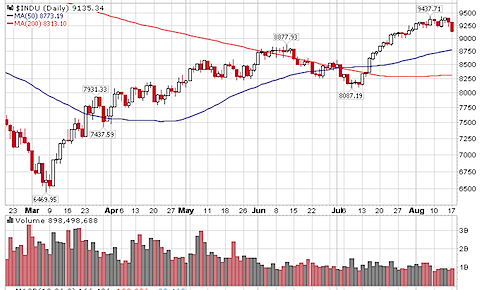
Of course, you do get some funny behavior when some of the index’s components were trading under $10, so number of shares necessarily increases to trade the same monetary value… and you can see most of 2007 was trading under 1b shares daily… but times are different, and it is that part of the year where the markets can be batted around with lower than typical volume.
We should see volume return in September or October… but only time will tell when the markets will see price movements on big volume that will give us the higher level of confidence that the market is actually acting like a market — seeking out the correct price level. When that time comes, remember that efficiency is a process, not a constant state of the markets.
Thu 6 Aug 2009
Mon 3 Aug 2009
I was just reviewing an old post on liquidity analysis, and I thought it would be worth re-visiting the topic with some updated graphs.
First, the context… from that post back in October 2006:
…there is a 4 step hierarchy in terms of what drives markets. The first step is liquidity, then flow of funds, sentiment, and microstructure indicators (i.e., microeconomics or technical analysis). The basic idea is that everything flows from liquidity, and that liquidity is the largest of all influencers. The liquidity environment (expansion or contraction) is the mother-trend and is the ?rising tide that raises all ships? when expanding.
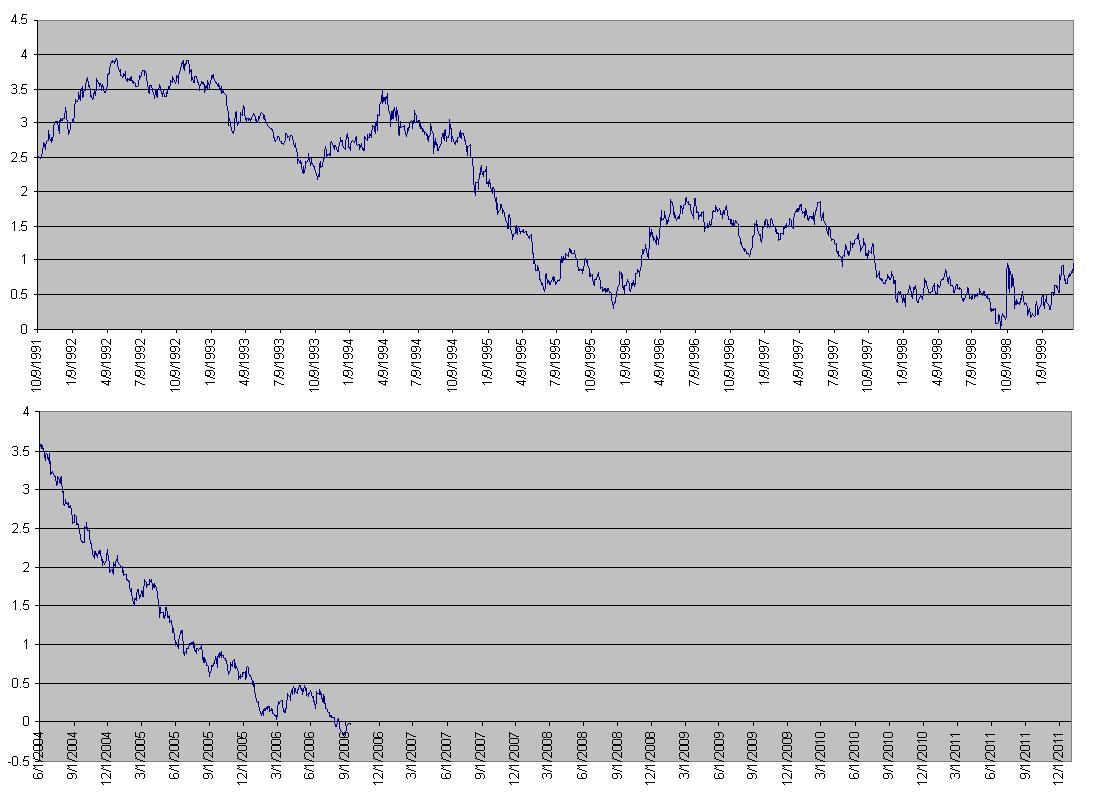
…A falling value on the chart of the yield-spread indicates liquidity expansion as the yield on the 10 year gets closer and closer to the 3 month. Inversion occurs when the value on the StockCharts graph is below 1.0. A rising value indicates liquidity contraction.
Here were the two charts presented in that post:
Now, on to the current situation. Suffice it to say, we’ve experienced quite a liquidity contraction, with interest rates dropping like crazy.
Let’s first look at the last 20 or so years… (click for detail)
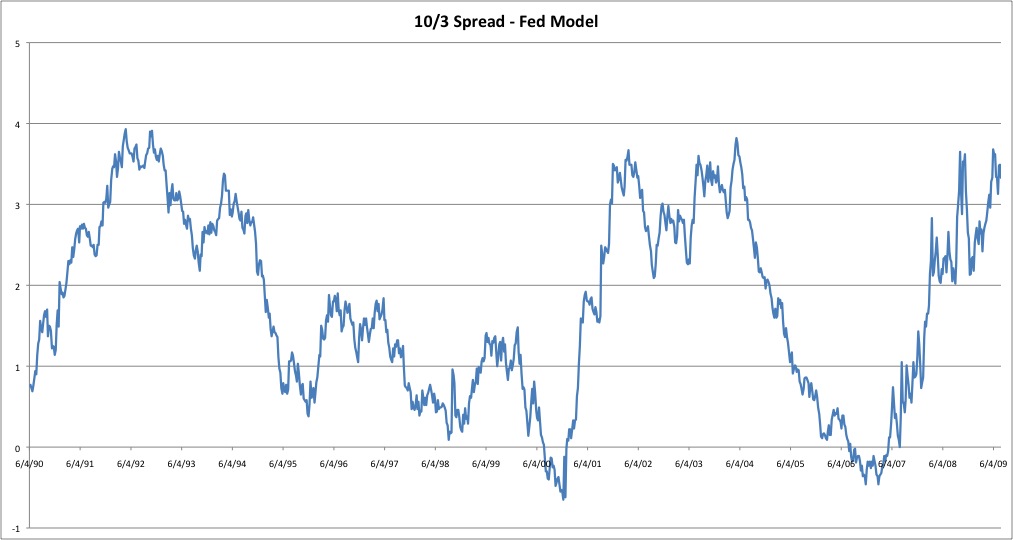
One quick note — the post in 2006 was written with yield spread inversion in mind. As we can plainly see, that inversion did not last long (6 months?), and the resulting rise in the yield spread obviously corresponds to the vanishing liquidity that we have endured since then.
It’s very interesting to note that the current spread between the 10 year and 3 month yields is back up to the same approximate levels as in 1991 as well as in 2001-2004, certainly both times of economic stress. Is this a natural stopping point for the yield spread? I’m not sure, but it will be interesting to watch. An argument could certainly be made that we have gone as far as we are likely to go in liquidity contraction, if things hold to the norms of the past two decades. (Note that any good statistician will tell you a sample size of 2 means nothing…)
Just as when the yield curve was inverted, it is important to wait for evidence of a trend change before passing any final judgement.
Tue 21 Jul 2009
A very good piece from The Globe and Mail, it’s an old interview with Niall Fergusen (from April) where he isn’t too optimistic about the length of the economic crisis.
The global crisis is far from over, has only just begun, and Canada is no exception, Mr. Ferguson said in an interview…
Policy makers and forecasters who see a recovery next year are probably lying to boost public confidence, he said. And the crisis will eventually provoke political conflict, albeit not on the scale of a world war, but violent all the same.
There will be blood, in the sense that a crisis of this magnitude is bound to increase political as well as economic [conflict]. It is bound to destabilize some countries.
And he concludes with this bit…
We just don’t have an improvement of standard of living of the sort we’re grown used to. And indeed if you have a more equitable redistribution through the tax system, which Obama is committed to, it might actually be no discernible downside for middle America and lower-class Americans. So many of the benefits of the boom went to the elites. If you have a lost decade plus redistribution, it may not be that dramatic a change for many, many people. People just have to get over the fact that their wealth wasn’t worth what they thought it was in 2006. Whether it’s their stock market portfolio or their housing. If we simply go back to where we were, in 2005, that’s surely not the worst thing that could happen to us.?
Also noteworthy is his comments about how much political power has been ceded back to congress from the executive branch. I guess that’s what happens when a legislator is elected to the presidency… he still has his legislative mentality.
Comments?
Tue 7 Jul 2009
Hilarious! From The King Report via Ritholtz (emphasis mine):
We are stunned ? no, we?re shocked, shocked over the following admission from an Assistant US Attorney about the theft of Goldman?s proprietary trading codes.
BN: At a court appearance July 4 in Manhattan, Assistant U.S. Attorney Joseph Facciponti told a federal judge that Aleynikov?s alleged theft poses a risk to U.S. markets. Aleynikov transferred the code, which is worth millions of dollars, to a computer server in Germany, and others may have had access to it, Facciponti said, adding that New York-based Goldman Sachs may be harmed if the software is disseminated.
?The bank has raised the possibility that there is a danger that somebody who knew how to use this program could use it to manipulate markets in unfair ways,? Facciponti said, according to a recording of the hearing made public today. [The prosecutor apparently does not understand the implications of his statement but most of The Street and much of the public do.] http://www.bloomberg.com/apps/news?pid=20601087&sid=ajIMch.ErnD4
Karl Denniger: Did Assistant US Attorney Facciponti make an erroneous statement, or did he just lay a nuclear egg on the table, step back, and set it off – on accident – admitting in open court that the software in question ?can be used to manipulate markets?? http://market-ticker.denninger.net/authors/2-Karl-Denninger
Zero Hedge: At least it is refreshing that none other than Goldman?s own de facto attorney admits that the firm has created a piece of code that permits ?market manipulation.?