Yay, the stock market is up, the economy is getting better, and we solved the mortgage problem — all it cost us was a few trillion dollars (ok, more than a few). We’re out of the woods, right?

Here is the chart we looked at a while ago with when mortgages with variable rates reset those rates… notice the big wave of green-ish stuff in 2007 and 2008? That’s what we just finished dealing with.

201003161538.jpg

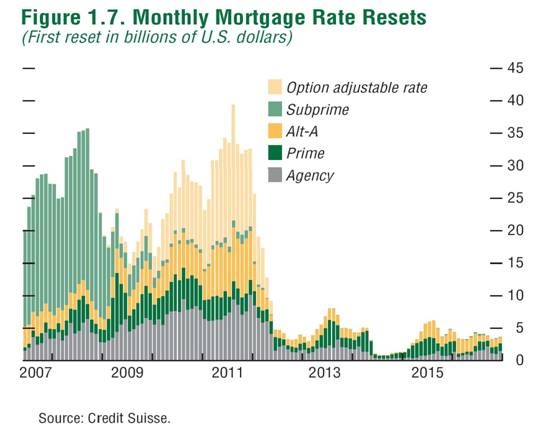
You might also notice that in front of us there is a big wave of yellow-ish stuff in 2010 and 2011. Interesting, no?

John Hussman wrote about this in his weekly review:

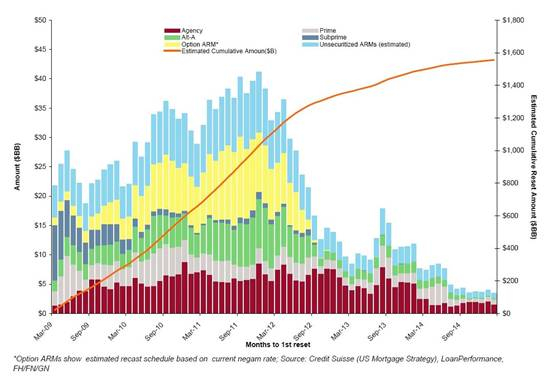
Below is a slightly different schedule we’ve seen. It doesn’t show the first round of sub-prime resets that ended in early 2009, and is based on different classifications, but is largely consistent with the overall profile we can anticipate.

201003151624.jpg

…To reiterate what the reset curve looks like here, the 2010 peak doesn’t really get going until July-Sep (with delinquencies likely to peak about 3 months later, and foreclosures about 3 months after that). A larger peak will occur the second half of 2011. I remain concerned that we could quickly accumulate hundreds of billions of dollars of loan resets in the coming months, and in that case, would expect to see about 40% of those go delinquent based on the sub-prime curve and the delinquency rate on earlier Alt-A loans.

If it cost us several trillion dollars, including nationalizing Fannie and Freddie to deal with the subprime wave of resets, what might happen with the second wave?

More great stuff from Hussman’s weekly commentary on Monday:

Aside from the shorter-term suspicion that unemployment has not peaked, I want to be clear that my main concern about the employment situation is with servicing debt, not providing for the basic needs of the population. I’m certainly not talking about Malthusian macroeconomic shortages or an inability for our nation to support itself. It is the gap between cash flows and household debt service that strikes me as problematic.

Hussman agrees with something I stated a while back… this is not your grandfather’s depression. While people starved to death in the dust bowl of the 30s, our struggle is less about survival and more about quality of life.

He then goes on with this comment:

Over the past decade we have greatly threatened that that stability through the ridiculous misallocation of resources in speculative bubbles and unproductive “investments,” but I am convinced that we will re-learn, painfully or otherwise, to better allocate our resources. My impression continues to be that the current deleveraging cycle will likely be a multi-year process that is presently far from complete.

Foreign trade can also be the source of mutual economic benefit, but only if it ultimately improves the allocation of resources. On our current path, we have instead relied on cheap imports from China and other countries while at the same time destroying our own capital through poorly allocated speculative investments, followed by bailouts to the lenders who provided that capital. The only plausible outcome of that dynamic is that foreigners will gradually acquire claims on our nation (Treasury debt or private securities), and with them, the ability to acquire our productive assets. No doubt many analysts on the financial channels will gurgle with excitement every time a foreign acquirer bids for ownership of a U.S. company, but this is how we will pay for our the difference between our consumption and our income. Again though, I am convinced that we will ultimately re-learn to better allocate our resources.

Good stuff.

Vitaliy Katsenelson has a good presentation on trouble brewing in China that is worth a quick review.

China – The Mother of All Black Swans – By Vitaliy Katsenelson

One of the data points mentioned is the New South China Mall. Here’s the Wikipedia entry for the mall:

New South China Mall (formerly South China Mall) in Dongguan, China is the largest mall in the world based on gross leasable area, and ranked second in total area to the Dubai Mall. Notably, it has been 99% vacant since its 2005 opening.

Think about that for a second. The mall is 5 years old and has never had more than 1% occupancy!

I do have one problem with Vitaliy’s presentation — misuse of the term Black Swan. Black Swans are rare events that are beyond the realm of normal expectations. While many mainstream economists (or politicians) might not fathom China collapsing, it has happened before and quite a few of us see it as something with a real probability of happening.

Today’s Dilbert comic is a bit too realistic…

Screen shot 2010-01-30 at 7.39.50 AM.png

Well, we didn’t get much of a bounce on Monday… that doesn’t bode well for the overall direction of the markets.

I ran some quick vol-by-price charts, and thought I would share. We’ve dropped 5% back into a pretty good congestion zone. A lot of shares have traded near current prices… We could very well wobble around in this range for a while yet. (chart source)

201001280741.jpg

And here’s the longer term (3 year) chart:

201001280743.jpg

Looks like there is some bigger price gravity between 800-900 and back up around 1450. There are compelling arguments for going in either direction, so be careful with your commitments in one direction or the other.

Here’s the “real” reason the market swooned at the end of last week… Goldman’s date for pricing their stock bonuses…

A humorous interlude demonstrates how the Administration’s quick-fire plans to punish Wall Street have in fact benefited firms such as Goldman which are increasingly paying bonuses in stock. As Bloomberg reports, Goldman priced the share bonus at Firday’s Goldman closing price of $154.12, which represents an 8.1% two-day slide in the stock price, in essence awarding Goldman employees with a comparably higher number of shares. With Goldman already trading at $157, or nearly 2% higher from Friday, Goldmanites have also locked in a short-term capital appreciation to boot.

From ZeroHedge.

In case anyone isn’t aware of the percentages, the last two days wiped out (and then some) all the gains so far in 2010.

While the S&P has only dropped 5%, it has happened in only 3 days.

I’m positioned for a bounce Monday morning, the three day drop is “too far too fast”. But I don’t expect a bounce to last.

And I consider this the warning shot that good times are over. If there is a bounce, it will likely be short lived. Then we can expect to see lower highs and lower lows… basically a return to a bear market.

When I make observations like this, I like to identify what would indicate that my analysis was incorrect. In this case, if the S&P is able to crawl back above 1150… especially if it is able to do so on higher volume.

Side Note: It’s worth commenting that 1150 was just a hair over a 50% retracement from 1576 all the way down to 666 (the 50% level was actually 1121).

From the Daily Reckoning… I for one am disheartened by this chart.

201001071559.jpg

Here’s a humorous little holiday carol about defaulting on a mortgage…


Found over at Mish.

From last week’s Hussman weekly commentary

Last week, the Mortgage Bankers Association released the most comprehensive report available on third quarter delinquencies. Here is a summary of points from that report:

?The delinquency rate for mortgage loans on one-to-four residential properties rose to a seasonally adjusted rate of 9.64% percent of all loans outstanding as of the end of the third quarter of 2009. The delinquency rate breaks the record set last quarter. The records are based on MBA data dating back to 1972. The combined percentage of loans in foreclosure or at least one payment past due was 14.41% on a non-seasonally adjusted basis, the highest ever recorded in the MBA delinquency survey.

?Job losses continue to increase and drive up delinquencies and foreclosures because mortgages are paid with paychecks, not percentage point increases in GDP. Over the last year, we have seen the ranks of the unemployed increase by about 5.5 million people, increasing the number of seriously delinquent loans by almost 2 million loans and increasing the rate of new foreclosures (on a quarterly basis) from 1.07 percent to 1.42 percent,? said Jay Brinkmann, MBA’s Chief Economist.

?Prime fixed-rate loans continue to represent the largest share of foreclosures started and the biggest driver of the increase in foreclosures. The foreclosure numbers for prime fixed-rate loans will get worse because those loans represented 54 percent of the quarterly increase in loans 90 days or more past due but not yet in foreclosure. The performance of prime adjustable rate loans, which include pay-option ARMs in the MBA survey, continue to deteriorate with the foreclosure rate on those loans for the first time exceeding the rate for subprime fixed-rate loans.

?The outlook is that delinquency rates and foreclosure rate will continue to worsen before they improve. The seriously delinquent rate, the non-seasonally adjusted percentage of loans that are 90 days or more delinquent, or in the process of foreclosure, was up from both last quarter and from last year. Compared with last quarter, the rate increased 82 basis points for prime loans (from 5.44 percent to 6.26 percent), and 216 basis points for subprime loans (from 26.52 percent to 28.68 percent).?

Yikes.

Here’s a nice chart from Clusterstock

200911291203.jpg

How to read this? For the year 2005, the year I bought my house, over 30% of the mortgages have negative equity.

« Previous PageNext Page »